

Question: A) For the p-chart, find the upper and lower control limits. Enter your response rounded to three decimal places. B) Based on your p-chart and
A) For the p-chart, find the upper and lower control limits. Enter your response rounded to three decimal places.
B) Based on your p-chart and the data from the last three weeks, what can we conclude about the absenteeism of nurses aides?
a) The proportion of absent aides from day 14 is above the UCL, so the process is not in control.
b) The proportion of absent aides from day 15 is below the LCL, so the process is not in control.
c) All sample proportions are within the control limits, so the process is in control.
d) The proportion of absent aides from day 13 is above the UCL, so the process is not in control.
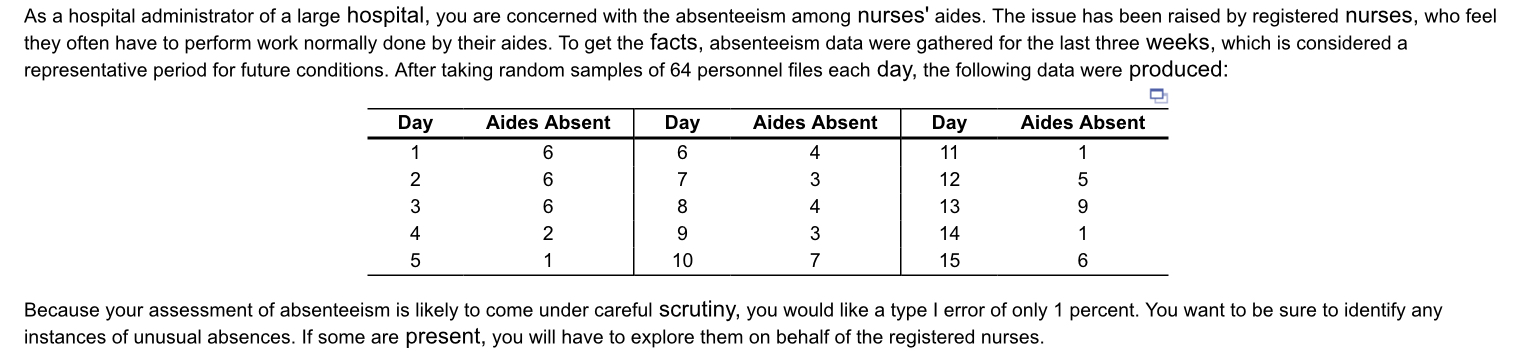
As a hospital administrator of a large hospital, you are concerned with the absenteeism among nurses' aides. The issue has been raised by registered nurses, who feel they often have to perform work normally done by their aides. To get the facts, absenteeism data were gathered for the last three weeks, which is considered a representative period for future conditions. After taking random samples of 64 personnel files each day, the following data were produced: Day Aides Absent Aides Absent Aides Absent 6 6 Day 6 7 1 2 4 1 3 5 Day 11 12 13 14 15 3 8 9 6 2 1 4 5 1 4 3 7 9 10 6 Because your assessment of absenteeism is likely to come under careful scrutiny, you would like a type I error of only 1 percent. You want to be sure to identify any instances of unusual absences. If some are present, you will have to explore them on behalf of the registered nursesStep by Step Solution
There are 3 Steps involved in it
1 Expert Approved Answer
Step: 1 Unlock

Question Has Been Solved by an Expert!
Get step-by-step solutions from verified subject matter experts
Step: 2 Unlock
Step: 3 Unlock