

Question: A) forecast demand for each week B) compute the MAD (median deviation) C) compute the tracking signal Homework: Chapter 4 Homework Save Score: 0 of
 A) forecast demand for each week
B) compute the MAD (median deviation)
C) compute the tracking signal
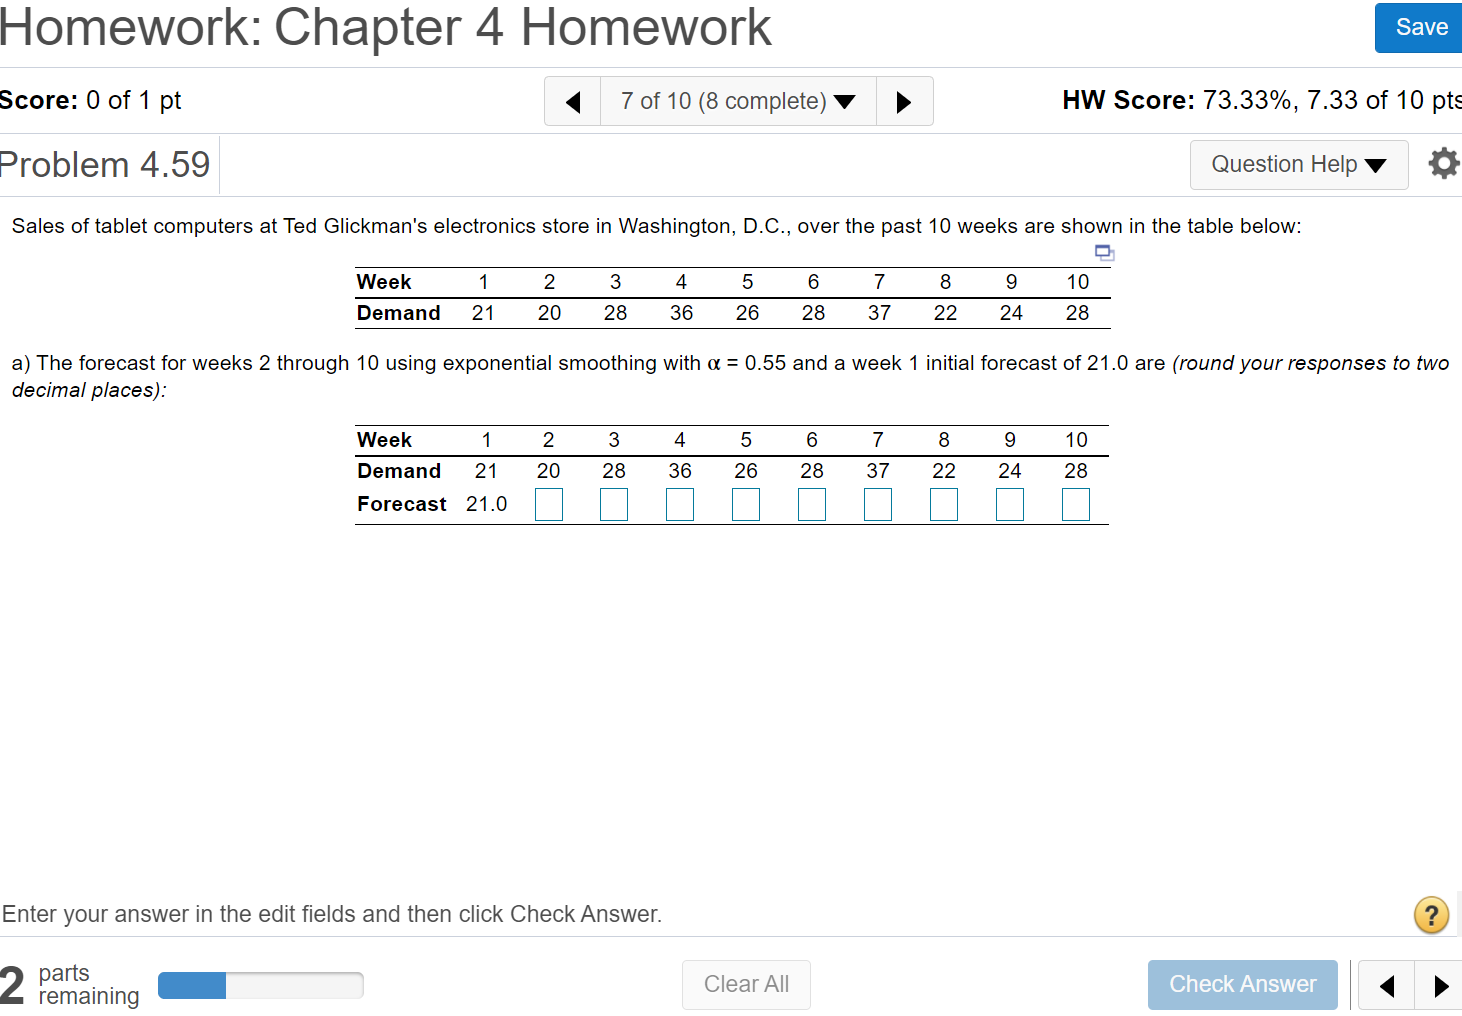
Homework: Chapter 4 Homework Save Score: 0 of 1 pt 7 of 10 (8 complete) HW Score: 73.33%, 7.33 of 10 pts Problem 4.59 Question Help Sales of tablet computers at Ted Glickman's electronics store in Washington, D.C., over the past 10 weeks are shown in the table below: 1 3 4 5 6 7 8 9 Week Demand 2 20 10 28 21 28 36 26 28 37 22 24 a) The forecast for weeks 2 through 10 using exponential smoothing with a = 0.55 and a week 1 initial forecast of 21.0 are (round your responses to two decimal places): 1 2 3 4. 5 6 7 8 9 10 Week Demand 21 20 28 36 26 28 37 22 24 28 Forecast 21.0 Enter your answer in the edit fields and then click Check Answer. ? 2 parts remaining Clear All CheckStep by Step Solution
There are 3 Steps involved in it
1 Expert Approved Answer
Step: 1 Unlock

Question Has Been Solved by an Expert!
Get step-by-step solutions from verified subject matter experts
Step: 2 Unlock
Step: 3 Unlock