

Question: A formula sheet is attached. Ratio 2012 2011 Quick Ratio Days in Inventory Days Sales in Receivable Total Debt Ratio Debt/Equity Ratio Equity Multiplier ROA
 A formula sheet is attached.
Ratio
2012 2011
Quick Ratio
Days in Inventory
Days Sales in Receivable
Total Debt Ratio
Debt/Equity Ratio
Equity Multiplier
ROA
ROE
Price/Earnings Ratio
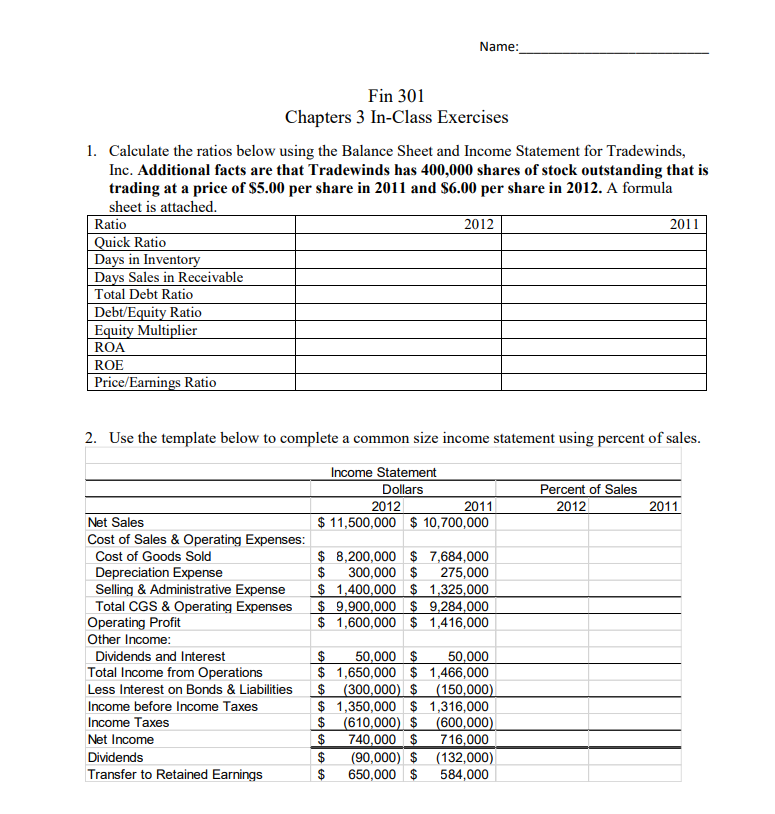
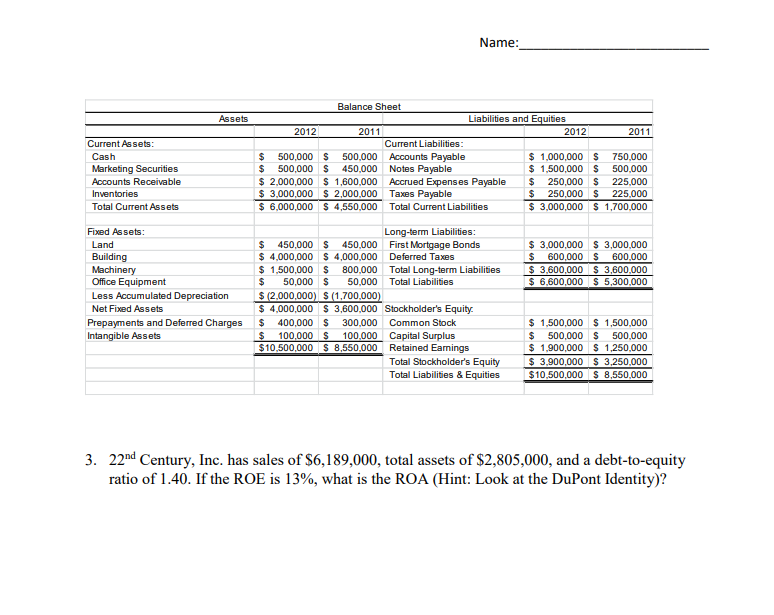
Name: Fin 301 Chapters 3 In-Class Exercises 1. Calculate the ratios below using the Balance Sheet and Income Statement for Tradewinds, Inc. Additional facts are that Tradewinds has 400,000 shares of stock outstanding that is trading at a price of $5.00 per share in 2011 and $6.00 per share in 2012. A formula sheet is attached. Ratio 2012 2011 Quick Ratio Days in Inventory Days Sales in Receivable Total Debt Ratio Debt/Equity Ratio Equity Multiplier ROA ROE Price/Earnings Ratio 2. Use the template below to complete a common size income statement using percent of sales. Income Statement Dollars 2012 2011 $ 11,500,000 $ 10,700,000 Percent of Sales 2012 2011 $ 8,200,000 $ 7,684,000 $ 300,000 $ 275,000 $ 1,400,000 $ 1,325,000 $ 9,900,000 $ 9,284,000 $ 1,600,000 $ 1,416,000 Net Sales Cost of Sales & Operating Expenses: Cost of Goods Sold Depreciation Expense Selling & Administrative Expense Total CGS & Operating Expenses Operating Profit Other Income: Dividends and Interest Total Income from Operations Less Interest on Bonds & Liabilities Income before Income Taxes Income Taxes Net Income Dividends Transfer to Retained Earnings $ 50,000 $ 50,000 $ 1,650,000 $ 1,466,000 $ (300,000) $ (150,000) $ 1,350,000 $ 1,316,000 $ (610,000) $ (600,000) $ 740,000 $ 716,000 $ (90,000) $ (132,000) $ 650,000 $ 584,000 Name: Assets Current Assets: Cash Marketing Securities Accounts Receivable Inventories Total Current Assets Balance Sheet Liabilities and Equities 2012 2011 2012 2011 Current Liabilities: $ 500,000 $ 500,000 Accounts Payable $ 1,000,000 S 750,000 $ 500,000 S 450,000 Notes Payable $ 1,500,000 $ 500,000 $ 2,000,000 $ 1,600,000 Accrued Expenses Payable $ 250,000 $ 225,000 $ 3,000,000 $2,000,000 Taxes Payable $ 250,000 S 225,000 $ 6,000,000 $ 4,550,000 Total Current Liabilities $ 3,000,000 $ 1,700,000 Fixed Assets: Land Building Machinery Office Equipment Less Accumulated Depreciation Net Fixed Assets Prepayments and Deferred Charges Intangible Assets $ 3,000,000 $3,000,000 $ 600,000 $ 600.000 $ 3,600,000 S 3,600,000 $ 6,600,000 $ 5,300,000 Long-term Liabilities: $ 450,000 $450,000 First Mortgage Bonds $ 4,000,000 $4,000,000 Deferred Taxes $ 1,500,000 $ 800,000 Total Long-term Liabilities $ 50,000 $ 50,000 Total Liabilities $ (2,000,000) S (1,700,000) $ 4,000,000 $ 3,600,000 Stockholder's Equity $ 400,000 $ 300,000 Common Stock $ 100,000 $100,000 Capital Surplus $10,500,000 $ 8,550,000 Retained Earings Total Stockholder's Equity Total Liabilities & Equities $ 1,500,000 $ 1,500,000 $ 500,000 $ 500,000 $ 1,900,000 $1,250,000 $ 3,900,000 $3,250,000 $ 10,500,000 $ 8,550,000 3. 22nd Century, Inc. has sales of $6,189,000, total assets of $2,805,000, and a debt-to-equity ratio of 1.40. If the ROE is 13%, what is the ROA (Hint: Look at the DuPont Identity)? Name: Fin 301 Chapters 3 In-Class Exercises 1. Calculate the ratios below using the Balance Sheet and Income Statement for Tradewinds, Inc. Additional facts are that Tradewinds has 400,000 shares of stock outstanding that is trading at a price of $5.00 per share in 2011 and $6.00 per share in 2012. A formula sheet is attached. Ratio 2012 2011 Quick Ratio Days in Inventory Days Sales in Receivable Total Debt Ratio Debt/Equity Ratio Equity Multiplier ROA ROE Price/Earnings Ratio 2. Use the template below to complete a common size income statement using percent of sales. Income Statement Dollars 2012 2011 $ 11,500,000 $ 10,700,000 Percent of Sales 2012 2011 $ 8,200,000 $ 7,684,000 $ 300,000 $ 275,000 $ 1,400,000 $ 1,325,000 $ 9,900,000 $ 9,284,000 $ 1,600,000 $ 1,416,000 Net Sales Cost of Sales & Operating Expenses: Cost of Goods Sold Depreciation Expense Selling & Administrative Expense Total CGS & Operating Expenses Operating Profit Other Income: Dividends and Interest Total Income from Operations Less Interest on Bonds & Liabilities Income before Income Taxes Income Taxes Net Income Dividends Transfer to Retained Earnings $ 50,000 $ 50,000 $ 1,650,000 $ 1,466,000 $ (300,000) $ (150,000) $ 1,350,000 $ 1,316,000 $ (610,000) $ (600,000) $ 740,000 $ 716,000 $ (90,000) $ (132,000) $ 650,000 $ 584,000 Name: Assets Current Assets: Cash Marketing Securities Accounts Receivable Inventories Total Current Assets Balance Sheet Liabilities and Equities 2012 2011 2012 2011 Current Liabilities: $ 500,000 $ 500,000 Accounts Payable $ 1,000,000 S 750,000 $ 500,000 S 450,000 Notes Payable $ 1,500,000 $ 500,000 $ 2,000,000 $ 1,600,000 Accrued Expenses Payable $ 250,000 $ 225,000 $ 3,000,000 $2,000,000 Taxes Payable $ 250,000 S 225,000 $ 6,000,000 $ 4,550,000 Total Current Liabilities $ 3,000,000 $ 1,700,000 Fixed Assets: Land Building Machinery Office Equipment Less Accumulated Depreciation Net Fixed Assets Prepayments and Deferred Charges Intangible Assets $ 3,000,000 $3,000,000 $ 600,000 $ 600.000 $ 3,600,000 S 3,600,000 $ 6,600,000 $ 5,300,000 Long-term Liabilities: $ 450,000 $450,000 First Mortgage Bonds $ 4,000,000 $4,000,000 Deferred Taxes $ 1,500,000 $ 800,000 Total Long-term Liabilities $ 50,000 $ 50,000 Total Liabilities $ (2,000,000) S (1,700,000) $ 4,000,000 $ 3,600,000 Stockholder's Equity $ 400,000 $ 300,000 Common Stock $ 100,000 $100,000 Capital Surplus $10,500,000 $ 8,550,000 Retained Earings Total Stockholder's Equity Total Liabilities & Equities $ 1,500,000 $ 1,500,000 $ 500,000 $ 500,000 $ 1,900,000 $1,250,000 $ 3,900,000 $3,250,000 $ 10,500,000 $ 8,550,000 3. 22nd Century, Inc. has sales of $6,189,000, total assets of $2,805,000, and a debt-to-equity ratio of 1.40. If the ROE is 13%, what is the ROA (Hint: Look at the DuPont Identity)
Step by Step Solution
There are 3 Steps involved in it

Get step-by-step solutions from verified subject matter experts