

Question: A frequency distribution for 25 student test scores in a probability and statistics course is shown below. Use this distribution for questions #45 -47 Student
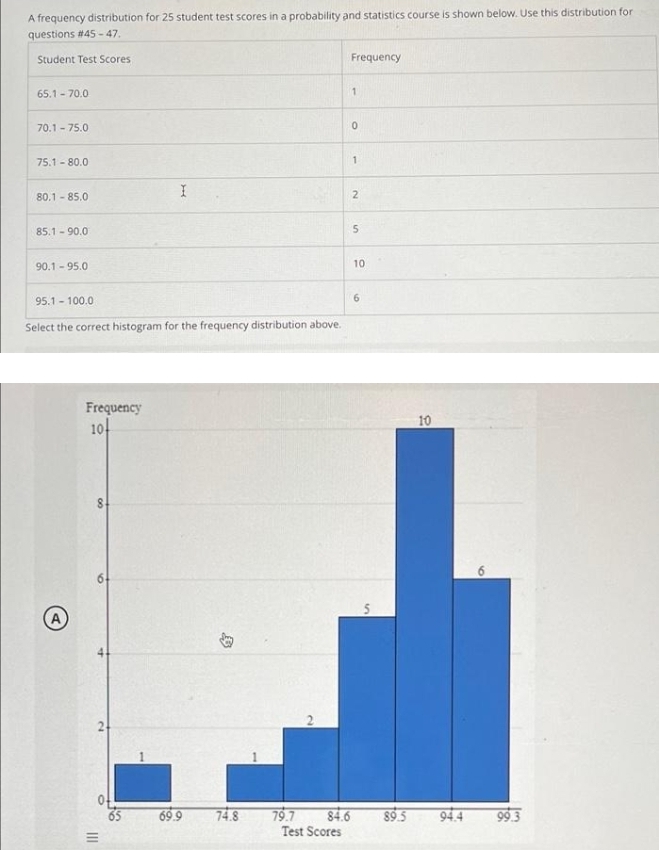
A frequency distribution for 25 student test scores in a probability and statistics course is shown below. Use this distribution for questions #45 -47 Student Test Scores Frequency 65.1 - 70.0 70.1 - 75.0 75.1 - 80.0 80.1 - 85.0 85.1 - 90.0 90.1 - 95.0 10 95.1 - 100.0 6 Select the correct histogram for the frequency distribution above. Frequency 10 10 8 6 A 5 4 2 65 69.9 74.8 79.7 84.6 89.5 94.4 99.3 Test Scores
Step by Step Solution
There are 3 Steps involved in it
1 Expert Approved Answer
Step: 1 Unlock

Question Has Been Solved by an Expert!
Get step-by-step solutions from verified subject matter experts
Step: 2 Unlock
Step: 3 Unlock