

Question: A function curve y = f ( x ) is graphed below. You can interact with the graph by sliding the endpoints of an interval
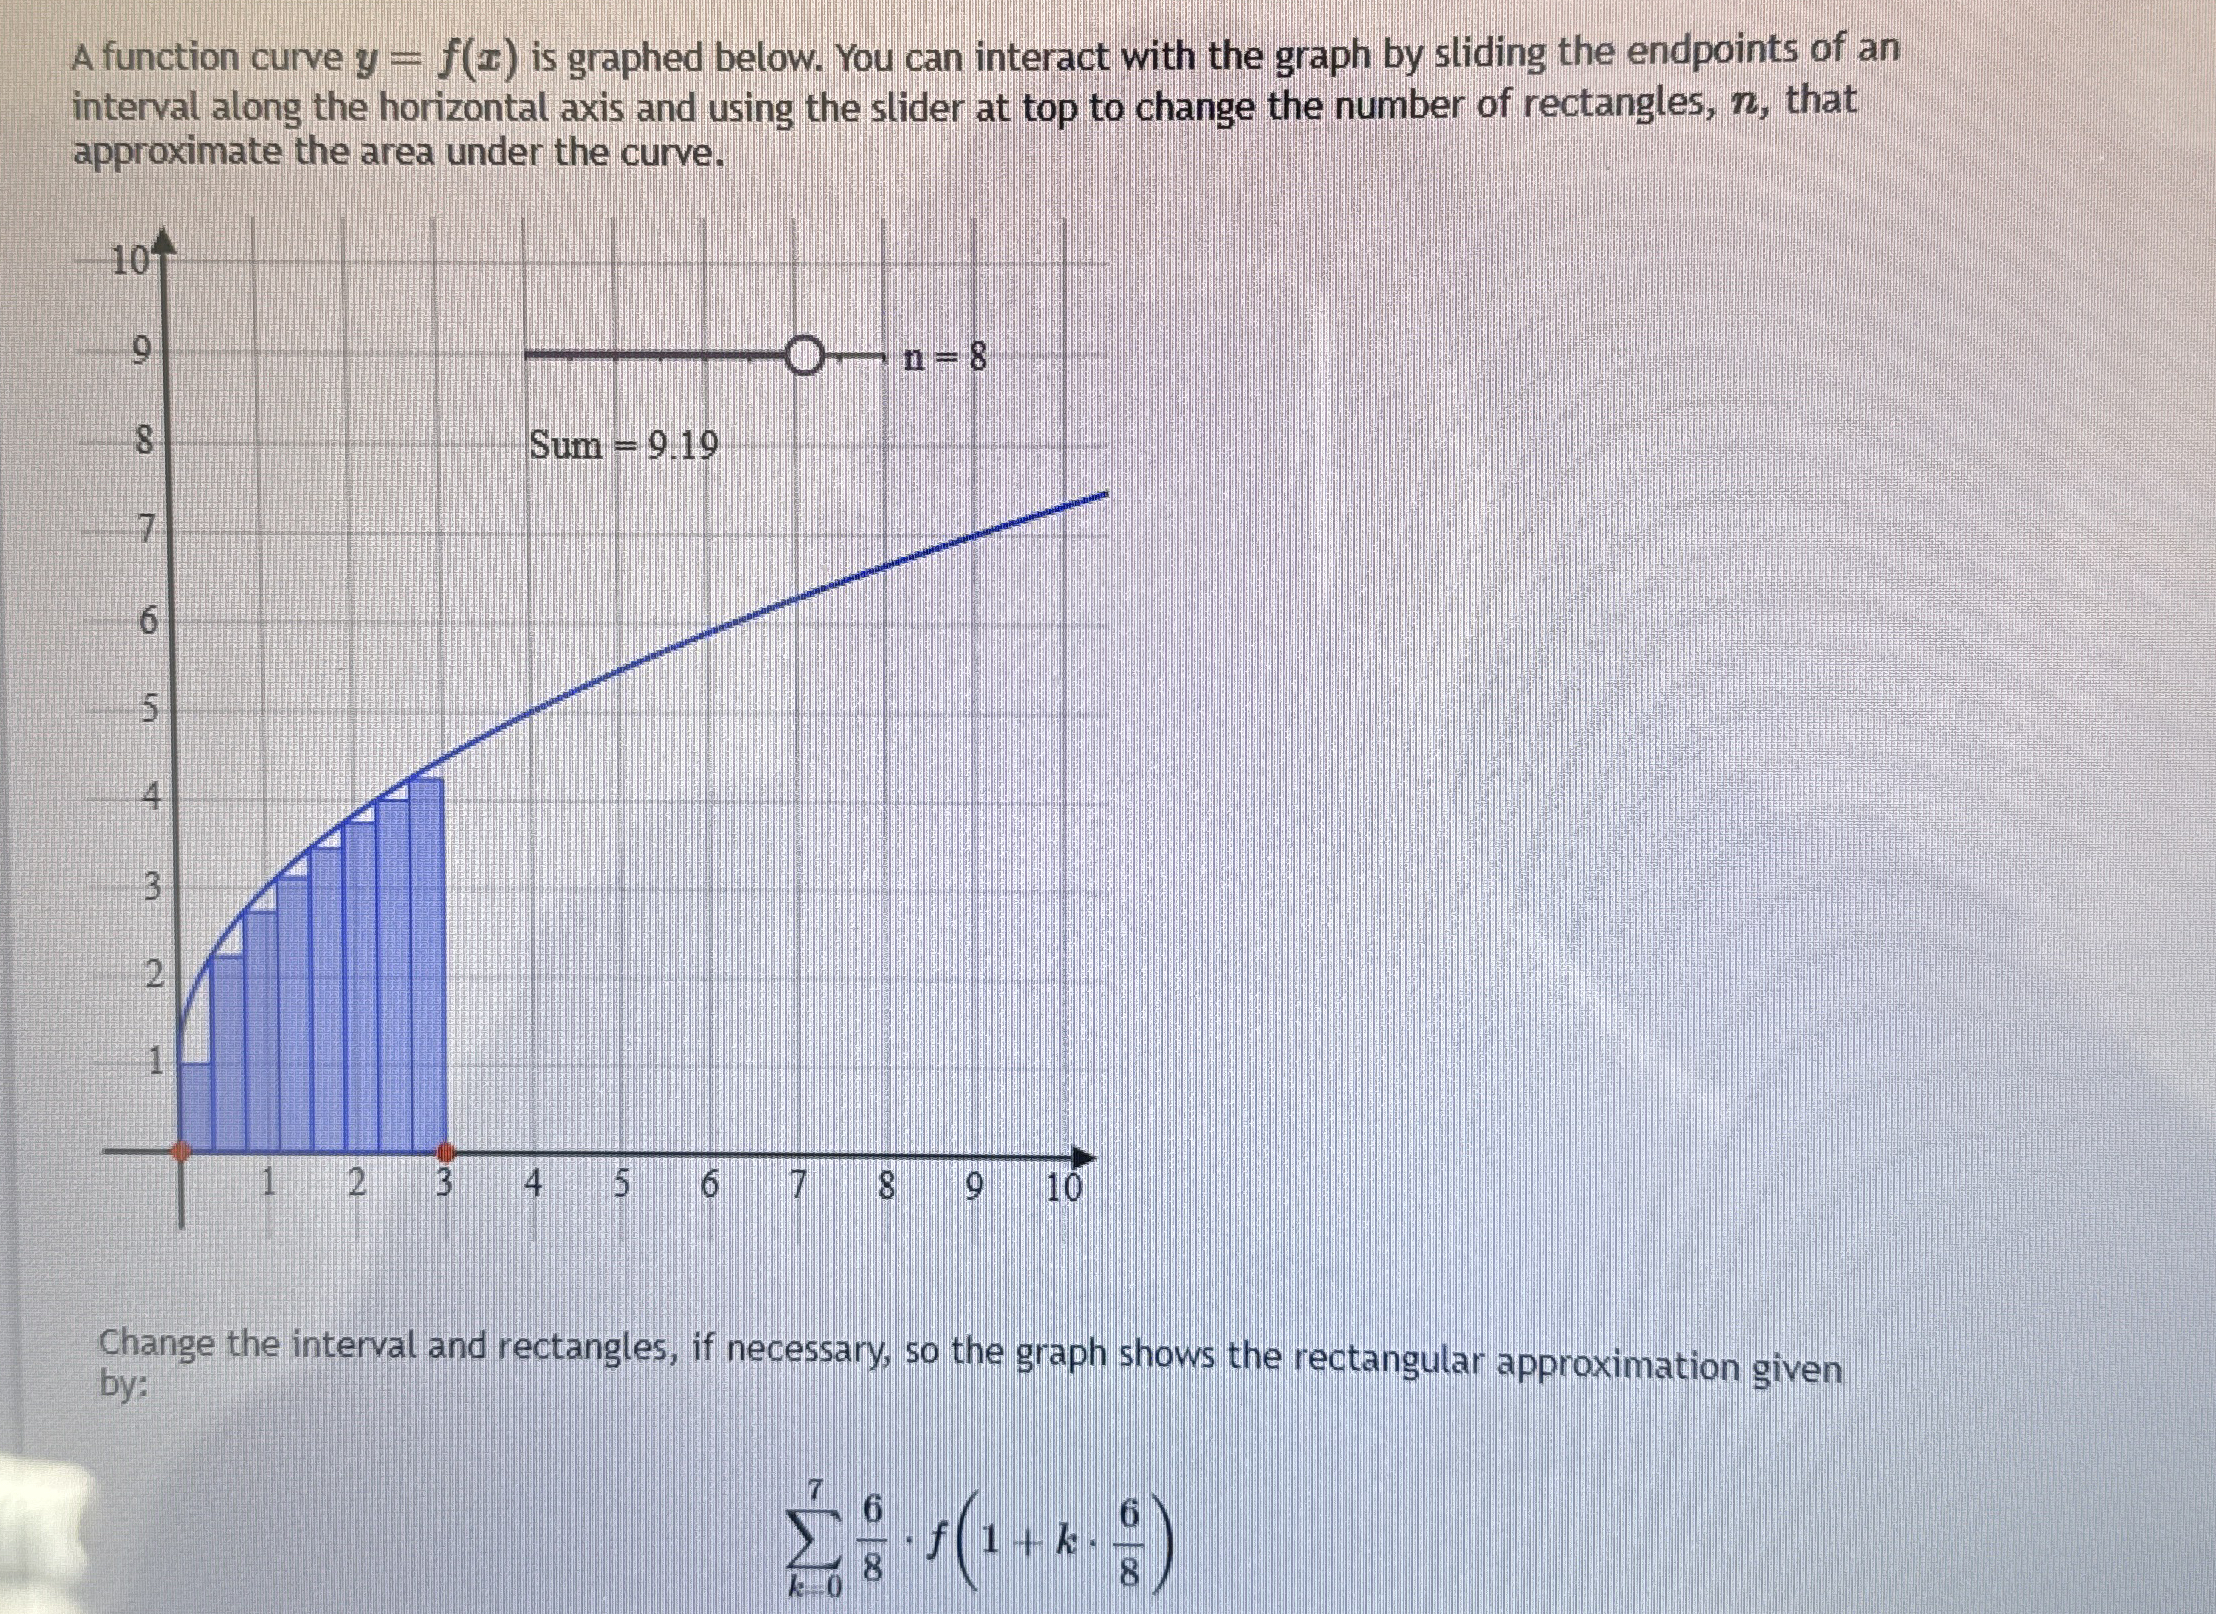
A function curve is graphed below. You can interact with the graph by sliding the endpoints of an interval along the horizontal axis and using the slider at top to change the number of rectangles, that approximate the area under the curve.
Change the interval and rectangles, if necessary, so the graph shows the rectangular approximation given by:
Step by Step Solution
There are 3 Steps involved in it
1 Expert Approved Answer
Step: 1 Unlock

Question Has Been Solved by an Expert!
Get step-by-step solutions from verified subject matter experts
Step: 2 Unlock
Step: 3 Unlock