

Question: A function is graphed below. On which interval of a is the average rate of change of the function the greatest? 26 24 22 (58,

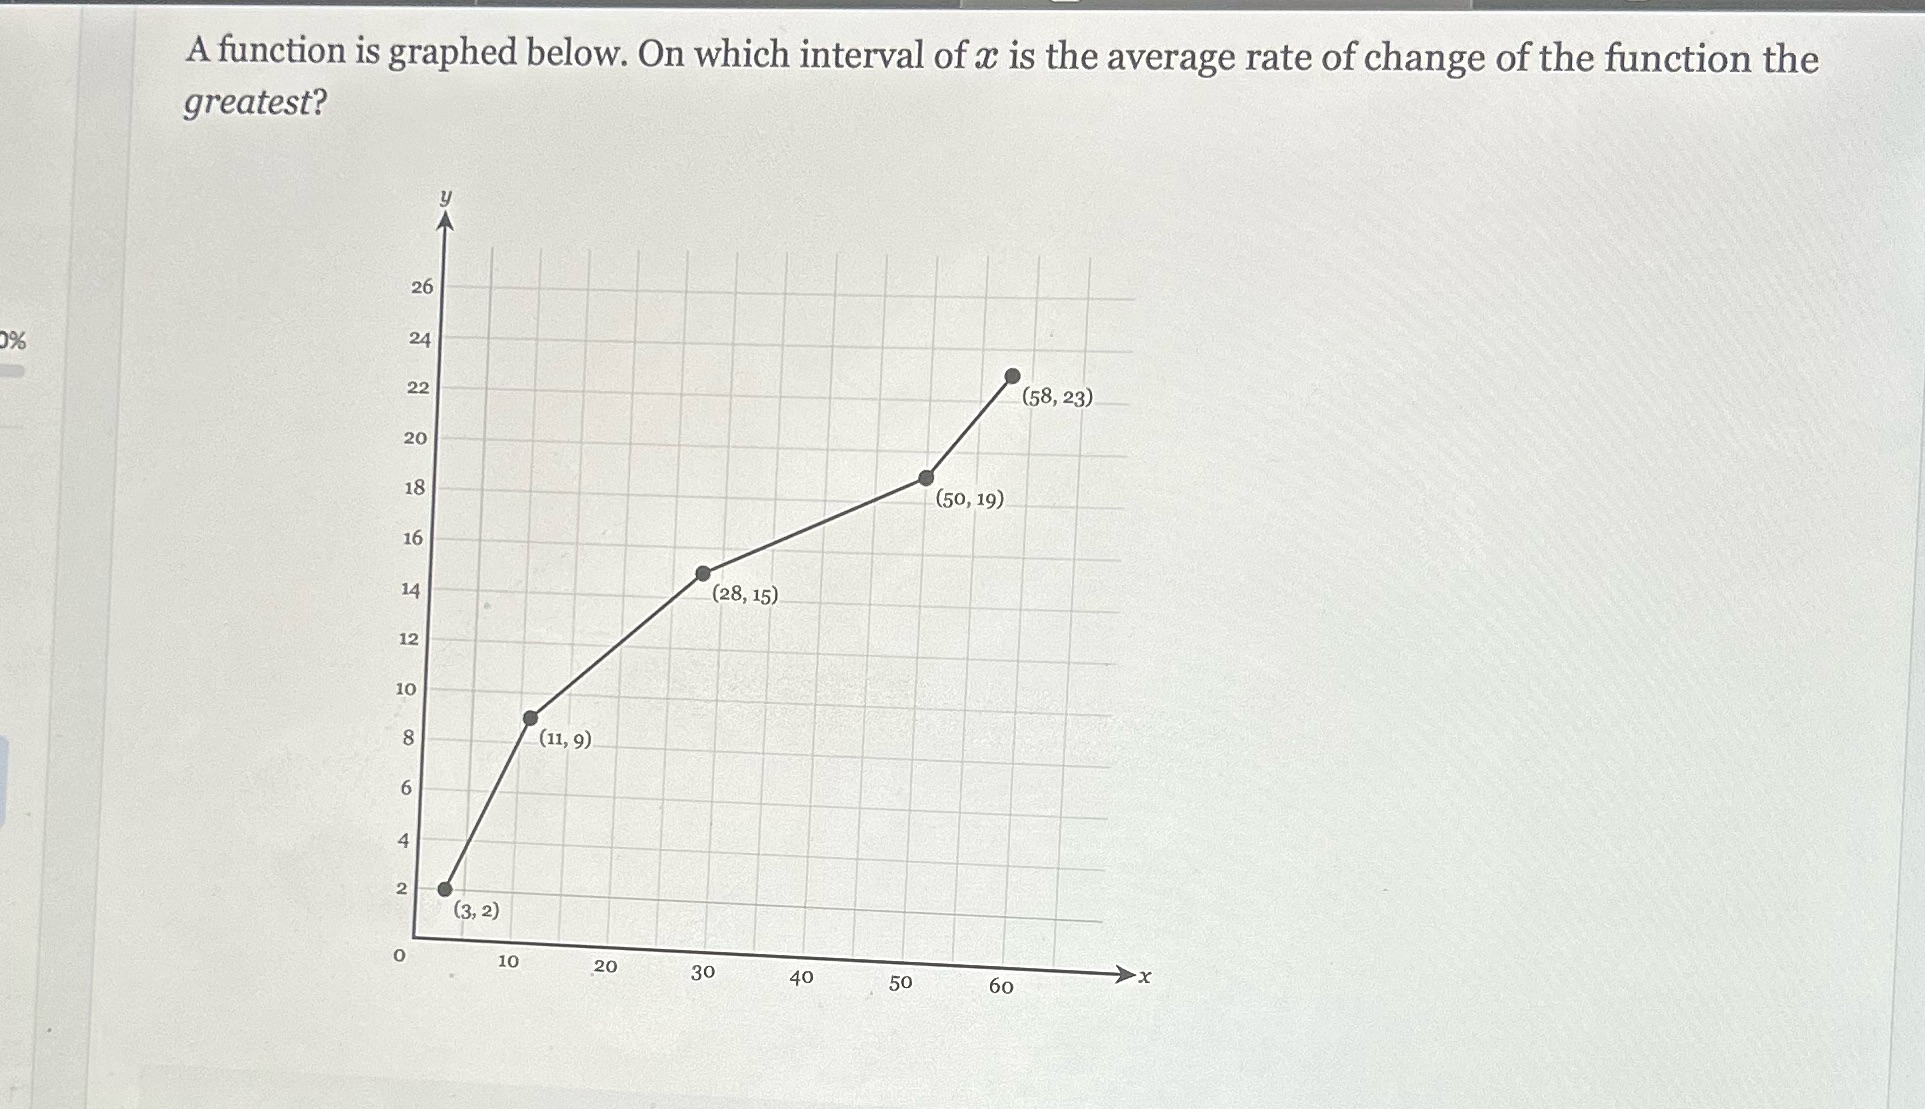
A function is graphed below. On which interval of a is the average rate of change of the function the greatest? 26 24 22 (58, 23) 20 18 (50, 19) 16 14 (28, 15) 12 10 (11, 9) 4 2 (3, 2) 10 20 30 40 -X 50 60
Step by Step Solution
There are 3 Steps involved in it
1 Expert Approved Answer
Step: 1 Unlock

Question Has Been Solved by an Expert!
Get step-by-step solutions from verified subject matter experts
Step: 2 Unlock
Step: 3 Unlock