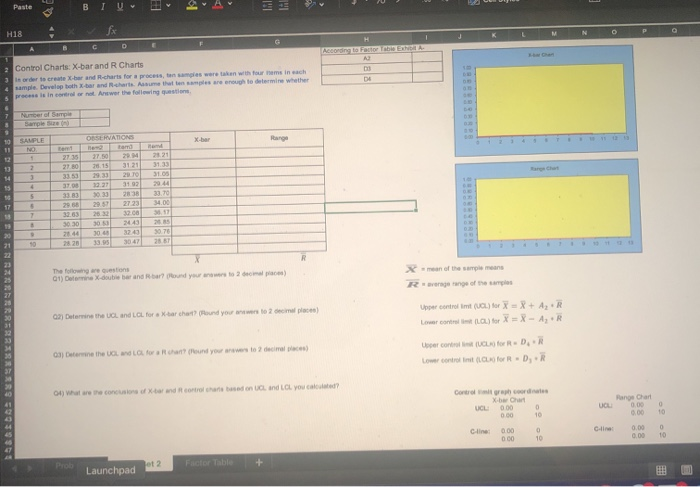
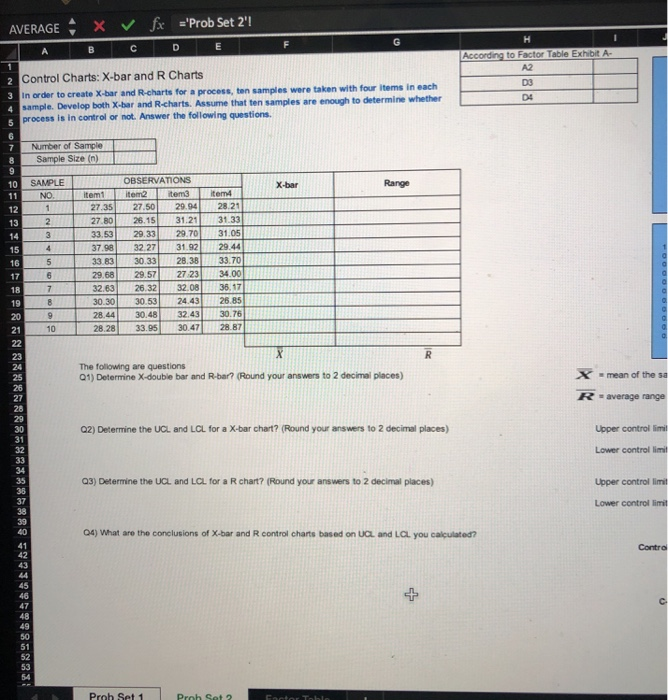
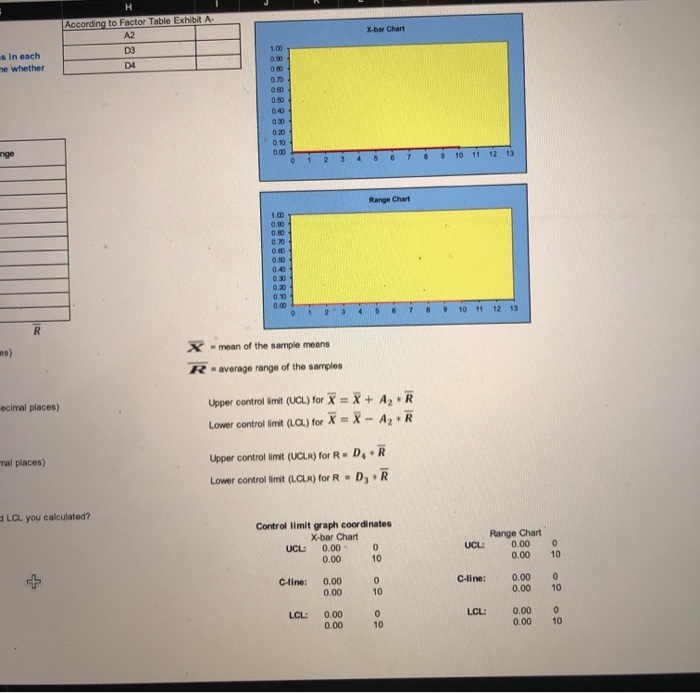
Question: A G 002 SE 1 . The fo o d but the sand that ESEBBest ESBEEEEEEEEEEEEEEEEEEEEEEEE H18 fx Control Charts: X-bar and R Charts order

A G 002 SE 1 . The fo o d but the sand that
A G 002 SE 1 . The fo o d but the sand that ESEBBest ESBEEEEEEEEEEEEEEEEEEEEEEEE H18 fx Control Charts: X-bar and R Charts order to re -brand charts for a procesa s taken with four minsach process is in control or not. Anwer the following question OBSERVATIONS SEBES 2820 33.55 3047 The 01) D Guestos ie X-beber and around your 2 ) 2) Determine the UCL and LGL for X-barchat (pound your loc al place Upper control L) X X + A +R LC) for X = X - AR L a) Den the UOL LOL han und e rstodecimal ) per conto Lower control UCLAR DR for D R 04) What are the color of trand b on UL and LCL you call Cord Launchpad 2 kutoSave ome Insert vX ABESUE Assie Draw Page Layout Formulas Data Review View Verdana 10 AA EEP Wrap Text 1 uw - Av EEEEEEMerge & Center v fx . Paste VERAGE X Intro) A metal fabricator produces connecting rods with an outer diameter that has a 1 +0.02 inch specification. A machine operator takes several sample measurements over time and determines the sample mean outer diameter to be 1.004 inches d adadadado LZ inch Co m Capability Index The following are some additional facts about the attematives and current situation: Q1) Calculate the process capably index for this example (Round your answer to 3 decimal places.) Sample Man Standard Deviath Lower Specific Upper Specificati C55 Prob Set 1 - Prob Set 2 Factor Enter | machine 04 inches Cpk = min X - LSL USL - X 30 30 Capability Index X-bar Sample Mean Standard Deviation Enter the values for the parameters of Lower Specification Limit LSL Upper Specification Limit USL X-LSLUSL-X 30 30 Cpk = Min AVERAGE X fx ='Prob Set 2'! According to Factor Table E Control Charts: X-bar and R Charts In order to create X-bar and R-charts for a process, ten samples were taken with four items in each sample Develop both X-bar and R.charts. Assume that ten samples are enough to determine whether process is in control or not. Answer the following questions. Number of Sample Sample Size (n) SAMPLE NO 1 OBSERVATIONS emitentem tem 27 35 27.50 20 041 28.21 27.80 26.15 31.21 31.33 33.53 29.33 29.701 31.05 37.98 32 271 31.92 2 944 20 33. 2 30 331 28 30 33.70 29.68 29.57 27 23 34.00 32.63 26 32 32.08 35.17 30.30 30.53 24.43 25.85 28.4430.4832.4330.76 28.28 33.95 30.47 28.87 5 The following are questions 01) Determine X-double bar and R-bar? Round your answers to 2 decimal places) X -mean of the sa R -average range 198898891ESE 88XXX8989ENNBRUNNSBORaewO Q2) Determine the UCL and LCL for a X-bar chart? (Round your answers to 2 decimal places) Upper controllimit Lower controllimit 03) Determine the UCL and LCL for a R chart? (Round your answers to 2 decimal places) Upper controllimit Lower controllimit 04) What are the conclusions of X-bar and control charts based on UCL and Layou calculated Contra + Penh Sat 11 Dead According to Factor Table Exhibit A N X-bw Chart in each whether D3 D4 10 11 12 13 Range Chart 6 7 8 9 10 11 12 13 X - mean of the sample means -average range of the samples R ecimal places) Upper controllimit (UCL) for X = X + A,.R Lower controllimit (LC) for X = X - A R mal places) Upper control Int (UCLR) for R. D Lower controllimit (LCLR) for R - D R R LCL you calculated? Controllimit graph coordinates X-bar Chart UCL: 0.00 0.00 Range Chart UCL: 0.00 C-line: 0.00 0.00 C-line: 0.00 0.00 LCL LCL 0.00 0.00

Step by Step Solution

There are 3 Steps involved in it

1 Expert Approved Answer
Step: 1 Unlock blur-text-image
Question Has Been Solved by an Expert!

Get step-by-step solutions from verified subject matter experts

Step: 2 Unlock
Step: 3 Unlock

Students Have Also Explored These Related General Management Questions!