

Question: A G H Common Size Analysis 99.75% 33.57% 23.27% 15.03% 4.06% 75.93% 23.82% -2.04% 0.25% -1.80% 22.02% . B D E F 6 Statement of
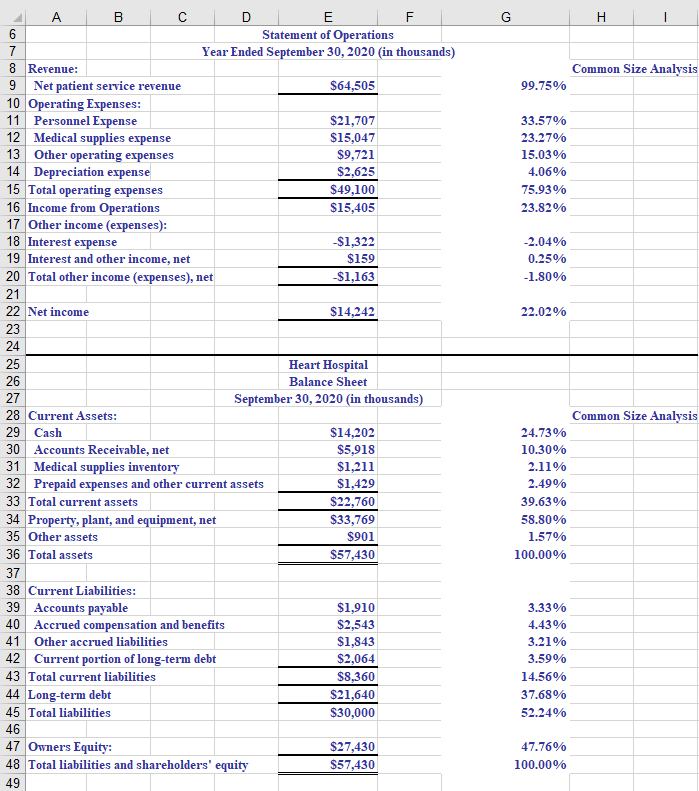
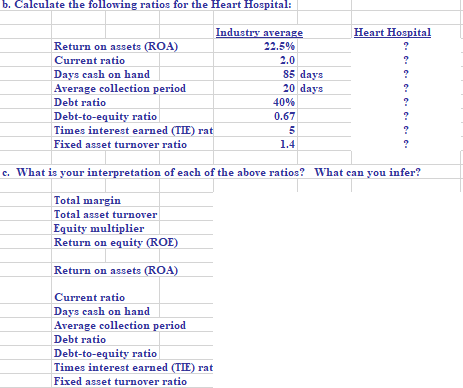
A G H Common Size Analysis 99.75% 33.57% 23.27% 15.03% 4.06% 75.93% 23.82% -2.04% 0.25% -1.80% 22.02% . B D E F 6 Statement of Operations 7 Year Ended September 30, 2020 (in thousands) 8 Revenue: 9 Net patient service revenue $64,505 10 Operating Expenses: 11 Personnel Expense $21,707 12 Medical supplies expense $15,047 13 Other operating expenses $9,721 14 Depreciation expense $2,625 15 Total operating expenses $49,100 16 Income from Operations $15,405 17 Other income (expenses): 18 Interest expense -$1,322 19 Interest and other income, net $159 20 Total other income (expenses), net -$1,163 21 22 Net income $14,242 23 24 25 Heart Hospital 26 Balance Sheet 27 September 30, 2020 (in thousands) 28 Current Assets: 29 Cash $14,202 30 Accounts Receivable, net $5,918 31 Medical supplies inventory $1,211 32 Prepaid expenses and other current assets $1,429 33 Total current assets $22,760 34 Property, plant, and equipment, net $33,769 35 Other assets $901 36 Total assets $57,430 37 38 Current Liabilities: 39 Accounts payable $1,910 40 Accrued compensation and benefits $2,543 41 Other accrued liabilities $1,843 42 Current portion of long-term debt $2,064 43 Total current liabilities $8,360 44 Long-term debt $21,640 45 Total liabilities $30,000 46 47 Owners Equity: $27,430 48 Total liabilities and shareholders' equity $57,430 49 Common Size Analysis 24.73% 10.30% 2.11% 2.49% 39.63% 58.80% 1.57% 100.00% 3.33% 4.43% 3.21% 3.59% 14.56% 37.68% 52.24% 47.76% 100.00% b. Calculate the following ratios for the Heart Hospital: Heart Hospital Industry average Return on assets (ROA) 22.5% Current ratio 2.0 Days cash on hand 85 days Average collection period 20 days Debt ratio 40% Debt-to-equity ratio 0.67 Times interest earned (TIE) rat 5 Fixed asset turnover ratio 1.4 c. What is your interpretation of each of the above ratios? What can you infer? Total margin Total asset turnover Equity multiplier Return on equity (ROE) Return on assets (ROA) Current ratio Days cash on hand Average collection period Debt ratio Debt-to-equity ratio Times interest earned (TLE) rat Fixed asset turnover ratio A G H Common Size Analysis 99.75% 33.57% 23.27% 15.03% 4.06% 75.93% 23.82% -2.04% 0.25% -1.80% 22.02% . B D E F 6 Statement of Operations 7 Year Ended September 30, 2020 (in thousands) 8 Revenue: 9 Net patient service revenue $64,505 10 Operating Expenses: 11 Personnel Expense $21,707 12 Medical supplies expense $15,047 13 Other operating expenses $9,721 14 Depreciation expense $2,625 15 Total operating expenses $49,100 16 Income from Operations $15,405 17 Other income (expenses): 18 Interest expense -$1,322 19 Interest and other income, net $159 20 Total other income (expenses), net -$1,163 21 22 Net income $14,242 23 24 25 Heart Hospital 26 Balance Sheet 27 September 30, 2020 (in thousands) 28 Current Assets: 29 Cash $14,202 30 Accounts Receivable, net $5,918 31 Medical supplies inventory $1,211 32 Prepaid expenses and other current assets $1,429 33 Total current assets $22,760 34 Property, plant, and equipment, net $33,769 35 Other assets $901 36 Total assets $57,430 37 38 Current Liabilities: 39 Accounts payable $1,910 40 Accrued compensation and benefits $2,543 41 Other accrued liabilities $1,843 42 Current portion of long-term debt $2,064 43 Total current liabilities $8,360 44 Long-term debt $21,640 45 Total liabilities $30,000 46 47 Owners Equity: $27,430 48 Total liabilities and shareholders' equity $57,430 49 Common Size Analysis 24.73% 10.30% 2.11% 2.49% 39.63% 58.80% 1.57% 100.00% 3.33% 4.43% 3.21% 3.59% 14.56% 37.68% 52.24% 47.76% 100.00% b. Calculate the following ratios for the Heart Hospital: Heart Hospital Industry average Return on assets (ROA) 22.5% Current ratio 2.0 Days cash on hand 85 days Average collection period 20 days Debt ratio 40% Debt-to-equity ratio 0.67 Times interest earned (TIE) rat 5 Fixed asset turnover ratio 1.4 c. What is your interpretation of each of the above ratios? What can you infer? Total margin Total asset turnover Equity multiplier Return on equity (ROE) Return on assets (ROA) Current ratio Days cash on hand Average collection period Debt ratio Debt-to-equity ratio Times interest earned (TLE) rat Fixed asset turnover ratio
Step by Step Solution
There are 3 Steps involved in it

Get step-by-step solutions from verified subject matter experts