Question: Financial Analysis Additional techniques should be used such as common size, segmental, trend, DuPont, share price, Z-score and anything else you feel relevant. Cash flow
Financial Analysis
Additional techniques should be used such as common size, segmental, trend, DuPont, share price, Z-score and anything else you feel relevant.
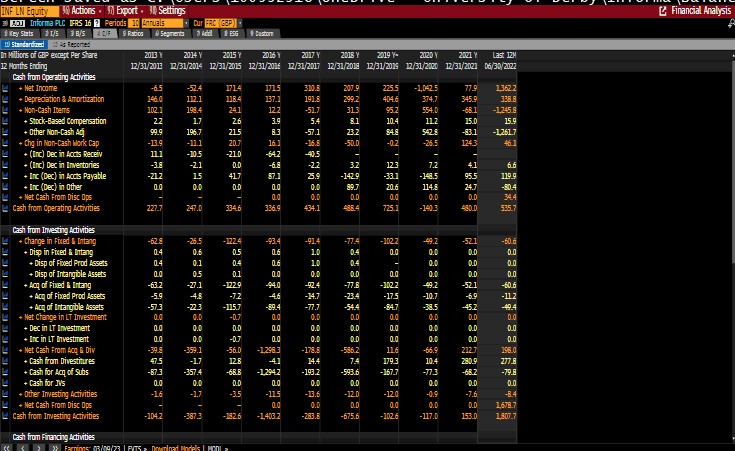
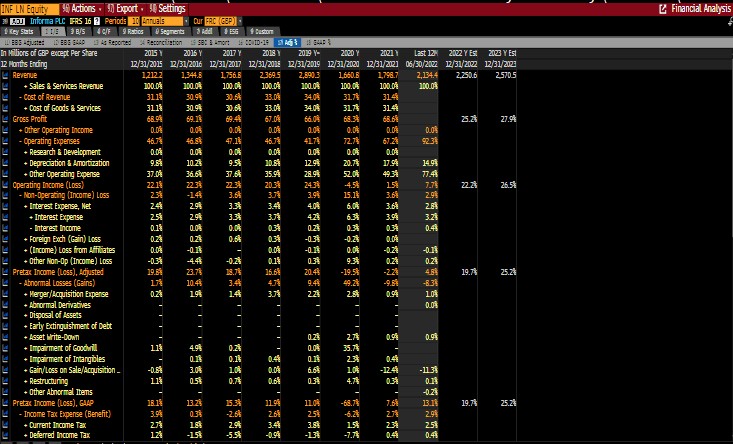
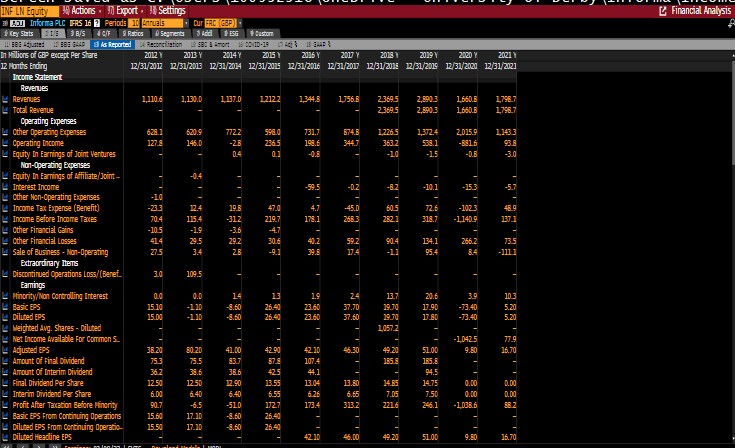
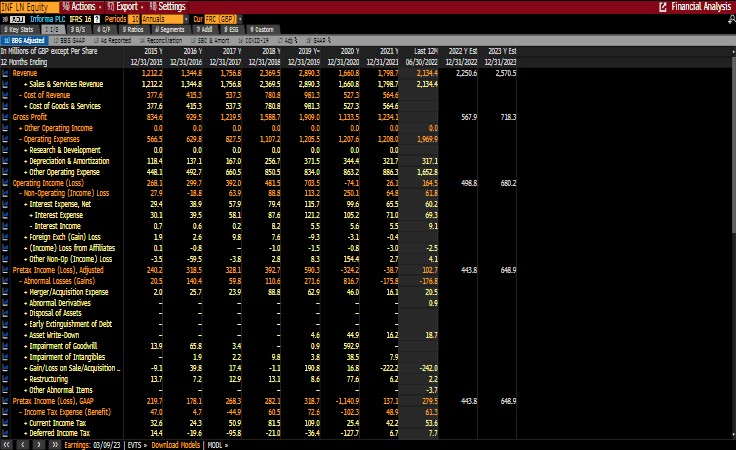
Cash flow & financing analysis
Cash flow & financing analysis will cover the sources of finance and management of cash. This section should link to findings in the financial analysis.
CALCULATE FOR 2021 and 2020
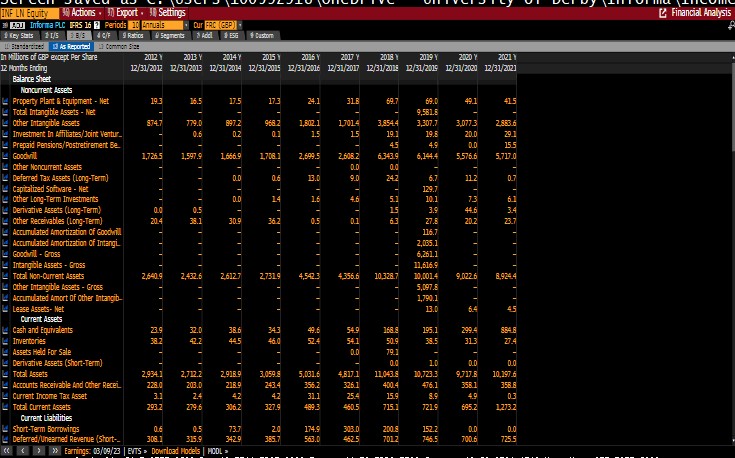
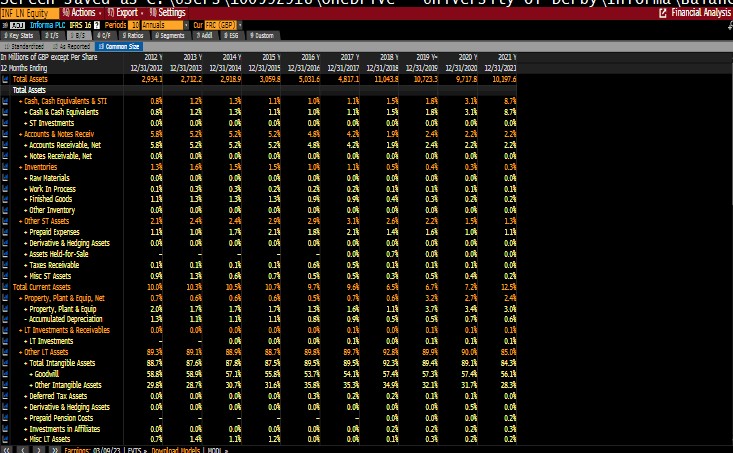
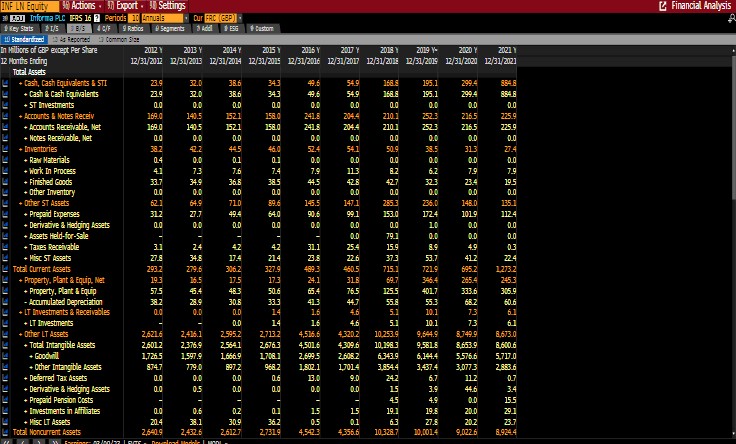
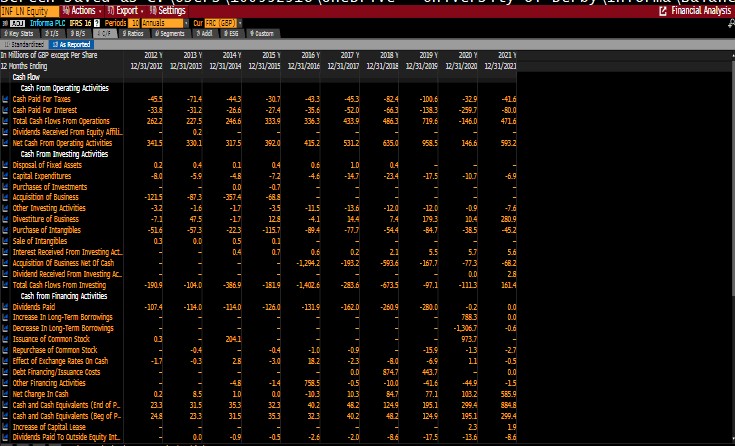
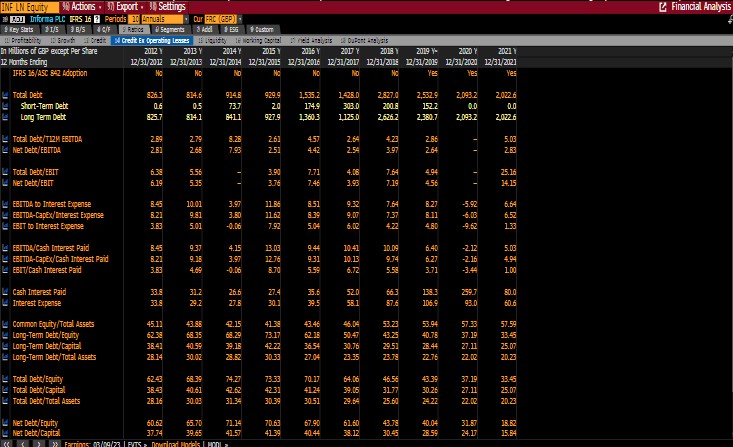
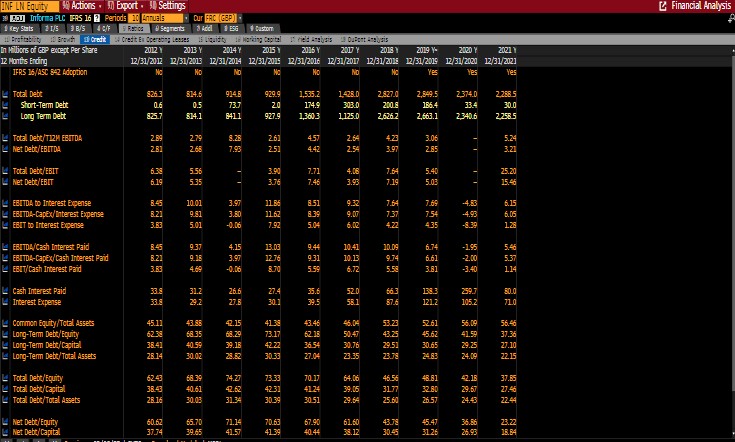
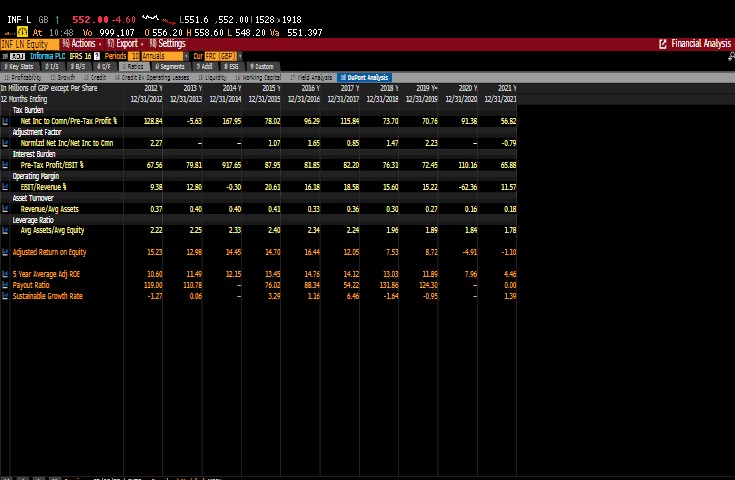
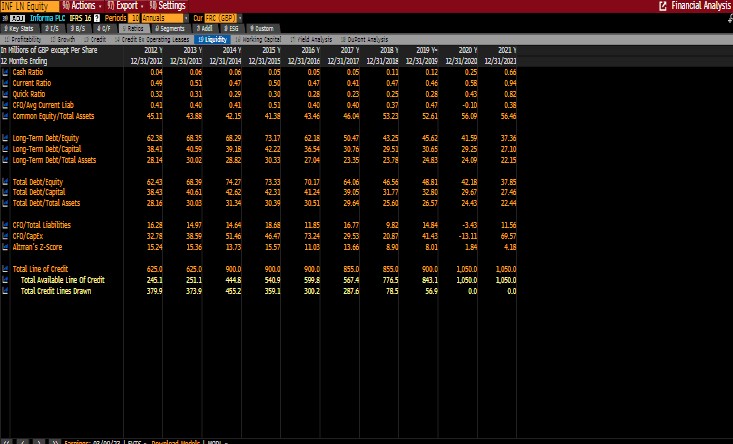
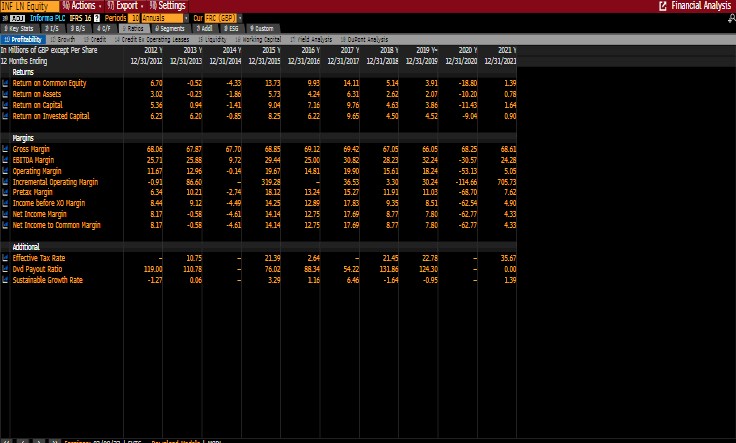
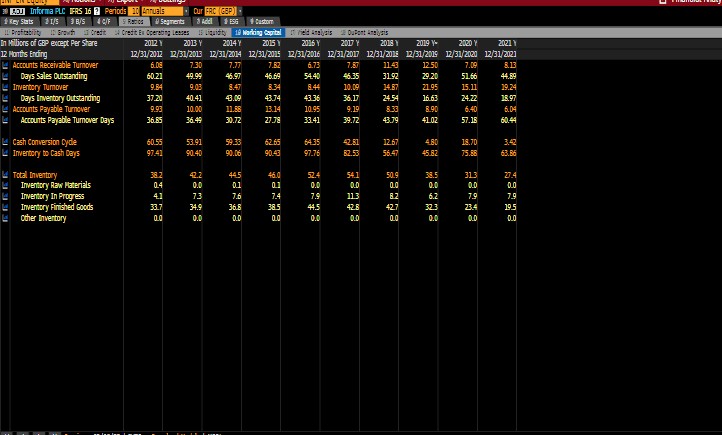
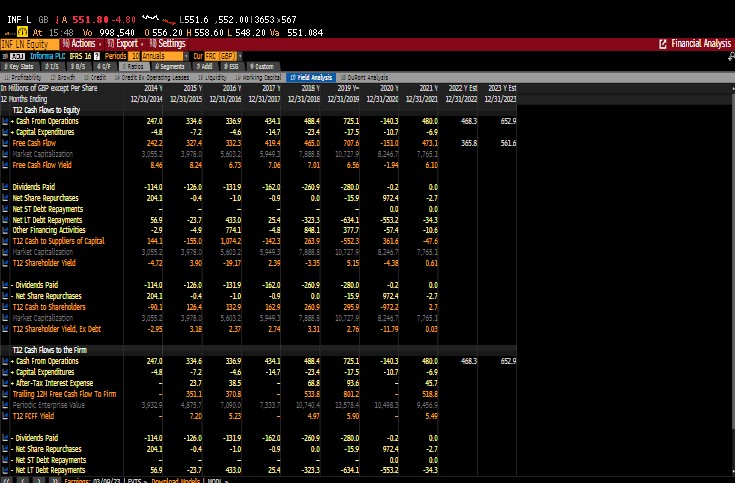
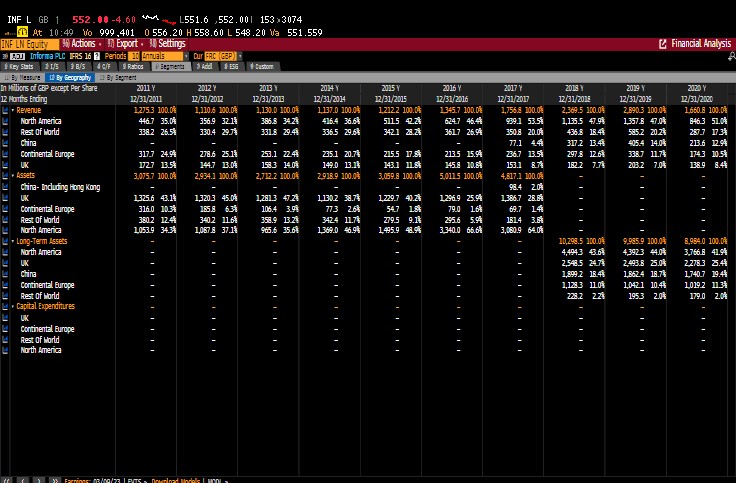
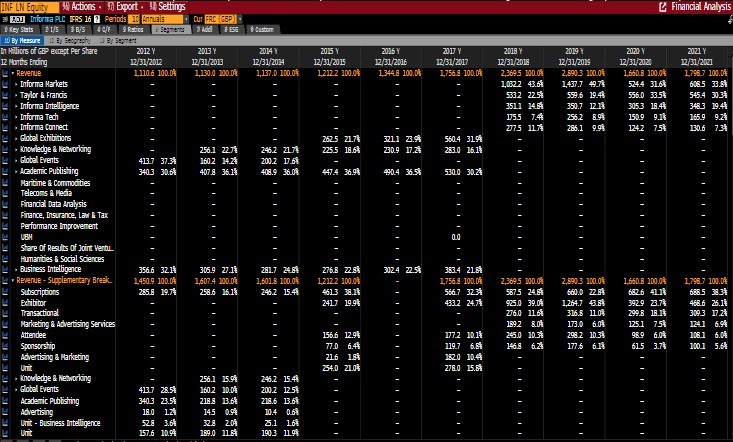
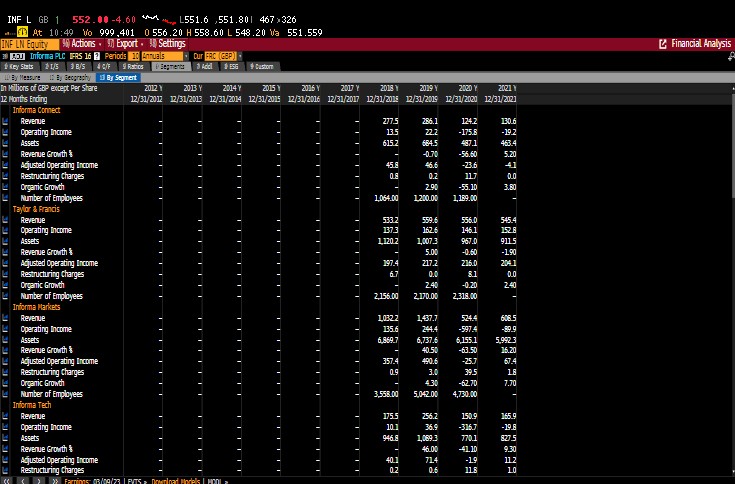
INF LN Equity 10 Actions . 17 Export . Settings Financial Analysis 23J Informa PLC IFRS 16 2) Periods|10 Annuals Cur FAC (GEP] Segments Add 256 Custom !! Standardized 13As Reported 27 Common 3:2: On Millions of GEP except Per Share 2013Y 2014 Y 2015 7 2016 Y 2017 Y 2018 1 2020 Y 2021 1 12 Months Ending 17/31/2012 12/31/2013 12/31/2014 12/31/2015 12/31/201 12/31/2017 12/31/201: 12/31/2015 12/31/2020 17/31/2021 Balance Sheet Noncurrent Assets Property Plant & Equipment - Net 19 3 16.5 17 5 173 24.1 318 64.7 69.0 49.1 Total Intangible Assets - Net 9,581.E Other Intangible Asgets 4747 179.0 897.2 368 2 1,82.1 17014 3.8544 3,307.7 3,0773 2.883 6 Investment In Affiliates/ Joint Venture OTE D.2 1.5 15 19.1 20.0 29 1 Prepaid Pensions/Postretirement Be. 45 4.9 15 5 Goodwill 1,7265 1,597.9 1 656.9 1.708. 2,699.5 2 608.2 6 3439 6,144.4 5.576.6 5,717_0 Other Noncurrent Assets D.D Deferred Tax Assets [Long-Term) 242 6.7 112 Capitalized Software - Net 129.7 Other Long-Term Investments 14 1.6 51 10.1 73 61 Derivative Assets (Long-Term) 05 15 3.9 14.6 3.4 Other Receivables (Long-Term) 2014 39.1 309 367 0.1 27.8 20.2 23.7 Accumulated Amortization of Goodwill 115.7 Accumulated Amortization Of Intanyi 2,085.1 Goodwill - Gross 5,261.1 Intangible Assets - Gross 11,616.9 Total Non-Current Assets 2,6419 2,432.6 26127 2,7319 4,542.3 4 356.6 10 3287 10,001.4 9.022 6 8.924.4 Other Intangible Assets - Gross 5,097.8 Accumulated Amort of Other Intangib 1,790.1 Lease Assets - Net 13.0 Current Assets Cash and Equivalents 39 32.D 38.6 343 49.6 54.9 195.1 299.4 Inventories 38 7 42.2 445 450 541 509 34.5 313 37 4 Assets Held For Sale D.D 79.1 Derivative Assets (Short-Term) 1.0 D.D Total Assets 2,9341 2,712.2 2918.9 3.054 8 5,031.6 11,043.8 10,723.3 9717 8 10.197 6 Accounts Receivable And Other Recei 238 0 243.4 356.2 326.1 400.4 76.1 358.1 358 8 Current Income Tax Asset 3.1 2.4 42 47 31.1 25.4 159 8.9 40 03 Total Current Assets 293.2 279.6 306.2 327.9 4893 450.5 715.1 721.9 695.2 1213.2 Current Liabilities Short-Term Borrowings 73.7 20 174.9 303.0 152.2 D.D Deferred/Unearned Revenue (Short-_ 308.] 315.9 342 3857 563.0 462 5 7012 746.5 725 5 CINF LN Equity 14 Actions . In Export . Settings 80 Informa PLC D:RS 16 2) Periods|10 Annuals 1 Key Stats |2 1/5 Cur FAC (GEP) Financial Analysis Custom A Reported Common 512: On Millions of GEP except Per Share 2014 Y 2015 7 12 Months Ending 2015 Y 2017 Y 2019 Y- 2020 Y 2021 7 Total Assets 12/31/2012 12/31/2013 12/31/2014 12/31/2015 12/31/2016 12/31/2017 12/31/201: 12/31/201 17/31/2020 12/31/20] 2,934.1 2,712.2 2.918 9 3.054 8 Total Assets 5,031.E 4 817.1 11,0438 10,72313 9717.8 10,197 6 + Cash, Cash Equivalents & STI D.EA 134 + Cash & Cash Equivalents 110 D.E 151 134 111 3.14 + ST Investments 114 15 D.CA 1 84 3.14 8.74 + Accounts & Notes Receiv 5.24 5.24 D.CA 5.21 . Accounts Receivable, Met 4.24 2.46 5.24 2.24 221 5.21 + Notes Receivable, Net 4.24 2.41 2.24 2:21 + Inventories 0.04 131 DOW 1.54 0.04 D.CA 151 + Raw Materials 104 114 D.DA 0.04 034 0.34 . Work In Process 0.04 D.CA 034 0.04 0.21 D.CA + Finished Goods 114 0.24 134 13 0.14 + Other Inventory 0.94 0.94 0.4 0.34 0.24 0.24 + Other ST Assets 241 2.4% 2 91 . Prepaid Expenses 2.94 111 3.14 2.64 104 2.21 1.74 1.56 13 + Derivative & Hedging Assets 14 + Assets Held-for-Sale 0.04 D.CA + Takes Receivable 0.04 0.14 0.04 0.CA + Hisc ST Assets 0.54 0.14 0.CA Total Current Assets 0.54 10 3 10.54 0.44 + Property, Plant & Equip, Net 9.74 9.54 6.51 6.74 0.64 7.2 12 54 + Property, Plant & Equip 0.74 2.04 D.6 174 3.24 2.74 1.A 24 - Accumulated Depreciation 171 134 11 1.14 11 3.4 + LT Investments & Receivables 0.94 3.04 0.51 0.04 0.74 D.64 D.CA + LT Investments 0.14 D.DA 0.14 + Other LT Assets 0.14 0.14 88.71 . Total Intangible Assets 69.74 92 E 80 gi 90.DA 87 .84 27.51 + Goodwill 84.54 92 31 58.8 89.41 58 94 57.14 84. 14 55.81 Other Intangible Assets 5274 54.14 29.E 574 30.74 5731 3161 57.4 56.14 + Deferred Tax Assets 35:34 D.DA 3174 D.CA + Derivative & Hedging Assets 0.24 0.14 0.04 D.CA . Prepaid Pension Costs 0.54 + Investments in Anlates 0.21 + Hisc LT Assets 14 1.14 0.21 0.24 121 0.24 0.14 0.24INF LN Equity $4 Actions . In Export . Settings Financial Analysis ADJ Informa PLC OFFAS 16 2) Periods |10 Annuals Cur FAC (GEP) . 10 Standardized |13 As Reported 13 Common B28 In Millions of GEP except Per Share 2012 1 XBY 2014 Y 2015 7 2015 Y 2017 Y 2018 7 2019 Y- 2020 Y 2021 7 12 Months Ending 12/31/2012 12/31/2013 12/31/2014 12/31/2015 12/31/2016 12/31/2017 12/31/2012 12/31/2016 12/31/2020 12/31/202] Total Assets . Cash, Cash Equivalents & STI 239 32.0 38.6 343 49.6 54.9 198 8 195.1 299.4 + Cash & Cash Equivalents 23 9 32.0 38.6 343 19.6 54.9 195.1 299.4 + ST Investments 0.0 D.D 0.0 D.D 0.0 D.D . Accounts & Notes Receiv 169 0 140.5 1521 158 0 241.8 204.4 2101 252.3 2165 275 9 + Accounts Receivable, Net 140.5 1621 158 0 241.8 204.4 210.1 216.5 225 9 + Notes Receivable, Net D.D 0.0 D.D D.D Inventories 38.2 2.2 445 46.0 52.4 54.1 509 38.5 313 27.4 + Raw Materials 0.4 0.1 O.D 0.0 D.D + Work In Process 41 73 7.6 7.4 7.9 113 6.2 79 79 + Finished Goods 337 34.9 36.6 38 5 44.5 42 8 42 7 52.3 33.4 195 . Other Inventory 0.0 D.D D.D D.D . Other ST Assets [ 29 64.9 710 145.5 147.1 285 3 236.0 148.D 135.1 + Prepaid Expenses 31.2 27.7 49.4 640 90.6 T66 153.0 172.4 1019 112.4 + Derivative & Hedging Assets 0.D D.D D.D 10 D.D . Asgets Held-for-Sale 79.1 D.D + Taxes Receivable 31 2.4 42 42 31.1 25.4 159 8.9 4.9 0.3 Hisc ST Assets 27_2 34.8 214 22 6 373 53.7 412 72 4 Total Current Assets 293.2 279.6 306.2 327.9 4893 450.5 715.1 721.9 695.2 1273.2 + Property, Plant & Equip, Net 19 3 16.5 17.5 173 24.1 318 64.7 3464 265.4 245 3 . Property, Plant & Equip 57.5 45.4 483 50 6 65.4 765 125 5 4017 333.6 305 9 - Accumulated Depreciation 38 2 21.9 30.8 333 413 447 55 9 553 68.2 606 + LT Investments & Receivables 0.0 D.D 14 1.6 4.6 5.1 10.1 73 61 + LT Investments D.D 14 1.6 46 5.1 10.] 73 61 + Other LT Assets 2,621.6 2,415.1 2 595.2 2,713.2 4,516.6 4 320.2 10.253.9 9,644.9 8.749.9 8.673 0 + Total Intangible Assets 2,601.2 2,376.9 2.5641 2 676 3 4,501.6 4309.6 10, 198 3 9,581 8 8.653.9 8.600.6 Goodwill 1,726 5 1,547.9 1 656.9 1708 1 2,699.5 2.608.2 63439 6,144.4 5,576.6 5.717_0 + Other Intangible Assets 8747 779.0 897.2 968 2 1,80.1 1,7014 3.854.4 3,437.4 3,0773 2 883 6 + Deferred Tax Assets D.D 0.6 13.0 9.D 242 6.7 112 D.7 Derivative & Hedging Assets 0.5 D.D 15 3.9 44.6 3.4 + Prepaid Pension Costs 45 49 15.5 + Investments in Ainlates 0.0 0.5 02 1.5 15 19 1 20.0 29 1 + Hisc LT Assets 214 30.9 36.2 0.5 63 27. 237 Total Noncurrent Assets 2,642.9 2,432.6 2,6127 2.731.9 4,543 4.356.6 10 328 7 10,001.4 9,022 6 8.924 4INF LN Equity 4 Actions . In Export . Settings Financial Analysis 23 Informa PLC OFRS 16 2) Periods |It Annuals Cur FAC (GEP] 1 Key Stats |1 1/5 1B/5 M Segments & Adel. Custom L Standardized 13 As Reported In Millions of GEP except Per Share 2013 Y 2014 Y 2015 1 2016 Y 2017 Y 2018 7 2020 Y 2021 1 12 Months Ending 12/31/2012 12/31/2013 12/31/2014 12/31/2015 12/31/2016 12/31/2017 12/31/201: 12/31/201 12/31/2020 12/31/202] Cash Flow Cash From Operating Activities Cash Paid For Taxes -45 5 -71.4 443 -3017 453 824 -100.6 325 416 Cach Paid For Interest -33 8 -31.2 -26.6 -27.4 -35.6 -520 -563 -1323 -2597 Total Cash Flows From Operations 262 2 227.5 246.6 383.9 3363 486 3 719.6 145 0 471 6 Dividends Received From Equity Affili 0.2 Net Cash From Operating Activities 3415 330.] 317.5 D ZGE 415.7 5312 635.0 958.5 145.6 593 7 Cash From Investing Activities Disposal of Fixed Assets 0.1 0.4 0.5 10 0.4 Capital Expenditures -5.9 -4.8 -72 4.6 -14.7 -23.4 -17.5 Purchases of Investments D.D -07 Acquisition of Business -1215 -873 357.4 Other Investing Activities 3.2 -1.6 -17 -35 -115 -13.6 -120 12.D Divestiture of Business -7_1 47.5 -17 12 8 -4.1 14 4 7.4 179 10.4 Purchase of Intangibles -51.6 -573 723 -115.7 -84 -77 7 -54.4 -84. 38 5 45 7 Sale of Intangibles 03 0.D 0.5 Interest Received From Investing Act. 0.7 0.2 21 5.5 Acquisition Of Business Net of Cash -1,294.Z -193.2 -593 6 -167.7 -773 Dividend Received From Investing Ar_ D.D 28 Total Cash Flows From Investing -1929 -104.D -346.9 1819 -1,402.6 -2:3.6 -6735 -97.1 -1113 161.4 Cash from Financing Activities Dividends Paid -107.4 -114.0 -1140 -126.0 -131.9 -162 0 -280.9 -0.2 Increase In Long-Term Borrowings 7283 Decrease In Long-Term Borrowings -1306.7 -06 Issuance of Common Stock 03 204.1 973.7 Repurchase of Common Stock 15.9 -13 -27 Effect of Exchange Rates On Cash -17 18.2 23 -6.9 11 -05 Debt Financing/ Issuance Costs D.D 8747 143.7 Other Financing Activities -14 758.5 -0.5 -10.0 41.6 -44.9 -15 Net Change In Cach 0.2 8.5 10 103 547 37.1 103.2 585 9 Cash and Cash Equivalents (End of P_ 2313 31.5 353 40.2 48.2 124.9 195.1 299.4 Cash and Cash Equivalents (Beg of P- 249 315 353 323 40.2 48 2 124.9 195 1 790 4 Increase of Capital Lease 23 19 Dividends Paid To Outside Equity Int. O.D -0.9 -05 -2.5 -20 -8.6 -17.5 -13.6 B.6INF LN Equity 4 Actions . In Export . JP Settings Financial Analysis 30 80 Informa PLC OF:AS 16 2) Periods|10 Annuals Cur FRC (EP) 1 Key Stats |1 1/5 8/5 Custom H Standardized 10 As Reported in Millions of GBP except Per Share 2014 Y 2015 Y 2016 1 2017 Y 2018 Y 2019 Y- 2020 2021 Y Last IZH 12 Months Ending 12/31/2013 12/31/2014 12/31/2015 12/31/200: 12/31/2017 12/31/2018 12/31/2006 12/31/2020 12/31/2021 06/30/2022 Cash from Operating Activities + Net Income -65 -52.4 1714 1715 310.8 207.9 225 5 -1,042.5 13627 Depreciation & Amortization 140 112.1 118.4 137.1 191.8 299.2 4046 374.7 345.9 338 8 * Non-Cash Items 102 1 1984 24.1 -51.7 313 957 554.D -68.1 -1245.8 . Stock-Based Compensation 2.2 1.7 26 3.9 5.4 8.1 10.4 11.2 15.0 15.9 + Other Non-Cash Acj 99 9 196.7 215 83 -57.1 23.2 542 8 -83.1 -12517 + Chy in Non-Cash Work Cap -13.9 -11.1 -16.6 50.D -25.5 1243 45 1 . (Inc) Dec in Aroots Receiv 111 -10.5 -210 -642 -405 + (Inc) Dec in Inventories -2.1 D.D -2.2 123 7.2 4.1 65 + Inc (Dec) in Aocis Payable -21.2 1.5 417 57.1 3.9 -142 9 -331 - 14.5 95.5 + Inc (Dec) in Other 0.0 D.D 0.0 20 6 114.2 247 -80.4 . Net Cash From Disc Ops 0.D D.D .D D.D Cash from Operating Activities 227.7 247.0 334.6 336.9 44.1 725.1 -1403 535. Cash from Investing Activities + Change in Fixed & Ditang -62 8 -26.5 1224 -93.4 -91.4 -77.4 -102.2 49 2 521 . Disp in Fixed & Intang 0.4 0.6 0.5 046 1.0 O.D + Disp of Fixed Prod Assets 0.4 0.1 0.4 06 1.0 0.0 D.D + Disp of Intangible Assets 015 0.1 0.0 D.D D.D . Acq of Fixed & Intang -63.7 -77.1 -940 -42 4 -77.8 -102 2 -521 . Acq of Fixed Prod Assets -5.9 -7.2 -46 -14.7 -23.4 -175 L'DI- -6.9 -112 + Acq of Intangible Assets -57.3 23 -1157 89.4 -71.7 -54.4 -647 -34.5 45.2 19.4 . Net Change in LT Investment 0.0 0.D -0.7 O.D D.D 0.D D.D + Dec in LT Investment D.D D.D D.D . Inc in LT Investment 0.0 -DJ O.D 0.0 . Net Cash From 40q & Div -359.1 -56.D -1 2983 -173.8 -586.2 116 -65.9 2127 198 0 . Cash from Divestitures 75 -1.7 128 -41 14.4 74 179 3 10.4 280.9 277 8 + Cash for Acq of subs -87.3 -357.4 -1 2942 -193.2 -543.6 -167 7 57.3 58.2 -79 8 + Cash for JVS 0.D D.D O.D D.D 0.0 D.D + Other Investing Activities -16 -1.7 -35 -115 -13.6 -12 D -120 -0.9 -J.6 -B.4 + Net Cash From Disc Ops O.D D.D Q.D D.D 1,678.7 Cash from Investing Activities -1047 -3873 -1826 -1,403.2 -675.6 -102 6 -117.0 153.0 1,807 Cash from Financing ActivitiesINF LN Equity 4 Actions . "] Export . Settings 20 80J Informa PLC OFRS 16 2) Periods|10 Annuals key Sats " Cur FAC (GEP]. B/S Financial Analysis # Segment 2 Adel. 1 383 justed 276 # Custom IN BBB BAAD 47 As Reported Reconciliation In Millions of GEP except Per Share 2015 Y 2017 12 Months Ending 2018 7 2019 Y- 2020 Y 2021 7 12/31/2015 12/31/2016 12/31/2017 12/31/2012 Last 124 2022 Y EST 2023 Y Est Revenue 12/31/2019 12/31/2021 12/31/2121 06/30/212: 1,212 2 1,344.8 1,756.8 12/31/2123 + Sales & Services Revenue 2 359 5 2,8903 1,650.8 1,798.7 100.04 2,134.4 100.CA 2,250.6 2 5705 - Cost of Revenue 100.04 3119 100.04 3094 100 0 30.54 33.CA + Cost of Goods & Services 3174 3114 314 30 98 Gross Profit 30.64 33.[A 3404 3174 68 54 314 + Other Operating Income 0.DA 27.94 - Operating Expenses D.DA 46 84 47.14 45 79 . Research & Development 41.74 72.74 D.DA 67.21 92 31 0.04 - Depreciation & Amortization 0.04 1024 9.54 . Other Operating Expense 10.81 12 94 37.04 20.74 1491 37.64 Operating Income (Loss) 35.54 22 1% 5201 723 77.41 - Non-Operating [Income) Loss 203 2434 231 -14 -4.54 159 3.64 7.74 3.71 25.5% . Interest Expense, Net 24 15.14 2 91 33% 3.4 + Interest Expense 40 6.04 251 3.6 2.94 2 81 3.34 - Interest Income 3071 4.21 3.21 . Foreign Exchange 0.74 0.24 0.41 . (Income) Loss from Anlates -034 D.CA -0.24 -On - Other Non-Op [Income) Loss -On 0.04 -031 -4.41 -0.21 -0.2 -On Pretax Income [Loss), Adjusted 9.34 23.74 0.21 0.21 Abnormal Losses (Gains) 16.68 171 -19.54 221 3.4% 4 84 471 19.74 25.24 . Merger/Acquisition Expense 9.41 49.24 19 14 -9.81 -834 + Abnormal Derivatives 10 + Disposal of Assets . Early Extinguishment of Debt . Accet Write-Down + Impairment of Goodwill 2.74 114 0.25 Impairment of Intangibles 35.74 0.14 . Gary'Loss on Sale/Acquisition - on 1.0 + Restructuring 11 -124 -11 34 0.76 + Other Abnormal Items D.6. Pretax Income [Loss), GAAP 11 94 - Income Tax Expense (Benefit] -60.74 2 65 19.74 25.21 Current Income Tax 251 271 -6.24 2.91 + Deferred Income Tax 2.94 3.4 17 -15 1.54 231 -5.5 -0.5A 251 -134 7.74 0.41INF LN Equity 34 Actions . 10] Export . Settings Financial Analysis 1 0 Informa PLC IFRS 16 2) Periods |10 Annuals Key Bats Segments Ackl 896 Custom W 283 Adjusted 10 383 9440 181 As Reported Reconciliation In Millions of GEP except Per Share XBY 2014Y 2015 1 2016 Y 2017 Y 2018 7 2019 1 2020 Y 12 Months Ending 17/31/2012 12/31/2013 12/31/2014 12/31/2015 12/31/2016 12/31/2017 12/31/2012 12 31/201 12/31/2021 12/31/202] Income Statement Revenues Revenues 1,1106 1,130.0 137.0 1212 2 1,344.8 1 756.8 2 359 5 2,8903 1,860.8 1,798.7 Total Revenue 2,8903 1.650.8 17987 Operating Expenses Other Operating Expenses 620.9 772.2 598 0 731.7 874.8 1 226.5 1,372.4 2.015.9 11433 Operating Income 127.9 145.0 -28 2365 198.6 363 7 538.1 -8216 23 8 Equity In Earnings of Joint Ventures -10 -1.5 -D.B -3.0 Non-Operating Expenses Equity In Earnings of Affiliate/ Joint - -0.4 Interest Income -59 5 -03 -82 -10.1 153 -5.7 Other Non-Operating Expenses 10 Income Tax Expense [Benefit] -23 47.0 47 -45 0 72.6 -102 3 Income Before Income Taxes 714 115.4 312 2197 178.1 2683 2821 318.7 -1 1409 1371 Other Financial Gains -1.9 -3.6 -47 Other Financial Losses 414 29.5 29.2 30 6 40.2 59.2 904 134.1 265.2 735 Sale of Business - Non-Operating 275 3.4 17.4 -11 95.4 B.4 -111 1 Extraordinary Items Discontinued Operations Loss/[Beret. 3.0 109.5 Eamings MinorityyMon Controlling Interest 14 13 1.9 24 20 6 3.9 103 Basic EPS 15.10 110 8.50 26.40 23.60 37.70 19.70 17.9 -73.40 5.20 Diluted EPS 15.00 110 -8.60 26.40 23.60 37.60 17.80 -73.40 5.20 Weighted Avg. Shares - Diluted 1,057-2 Net Income Available For Common S. -1042 5 77_9 Adjusted EPS BB.20 81 20 41.00 47 90 42 10 46.30 49.20 51 00 9.80 16.70 Amount Of Final Dividend 753 15.5 87.9 107.4 185 8 185.8 Amount Of Interim Dividend 36.2 32.6 38.6 42 5 44.1 94.5 Final Dividend Per Share 12 50 12 50 12.90 13.55 13.H4 13.80 14.85 14.75 0.DO Interim Dividend Per Share 6.00 6.40 5.40 6.55 6.26 5.65 7.05 7.50 Profit After Taxation Before Minority 90.7 6.5 510 1727 173.4 313.2 221 6 246.1 -1,038.6 Basic BPS From Continuing Operationes 15.60 17.10 -8.60 26.40 Diluted EPS From Continuing Operatic- 15.50 17.10 -8.60 26.40 Diluted Headline EPS 42 10 45.00 49.20 5100 9.80 16.70INF LN Equity 4 Actions . In Export . Settings Financial Analysis 1 40J Informa PLC IFAS 16 2) Periods |10 Annuals CUT FAC (GEP) 38/S C/F 9 Ratios W Segments 1 Add 1 836 Custom 10 BEG Adjusted |10 383 3-40 13 As Reported 34 Reconciliation In Millions of GBP except Per Share 2015 1 2015 Y 7017 Y 2018 2019 Y- 2020 Y Last 134 2022 Y Es 203 Y Est 12 Months Ending 12/31/2015 12/31/2016 12/31/2017 12/31/2012 12/31/2019 12/31/2020 12/31/2021 06/30/2022 12/31/2021 17/31/213: anuanaH 1,212 2 1,344.8 1,756.8 2 369 5 1.650.8 1798.7 2,134.4 2,250.6 2 5705 + Sales & Services Revenue 1212 2 1,344.8 1 756.8 2 3695 2,8903 1.650.8 1 798.7 2,134.4 - Cost of Revenue 377_6 5373 5273 564.6 + Cost of Goods & Services 3776 41653 5373 ELBE 5273 5646 Gross Profit 8346 929.5 1219.5 1584.7 1,909.D 1 133.5 12341 567.9 718 3 Other Operating Income J.D D.D 0.D 0.0 - Operating Expenses 5665 629.8 2275 1 107.2 1,205.5 1,207.6 1.208 0 1,969.9 + Research & Development 0.D D.D O.D + Depreciation & Amortization 118 4 137. 167 0 256.7 371.5 344.4 LTZE 317.1 . Other Operating Expense 4481 492.7 650.5 2505 163.2 886 3 1,6528 Operating Income (Loss) 299.7 3920 4815 JOB .5 -74.1 26.1 164.5 498.8 680.2 - Non-Operating [Income) Loss 27.9 -18.5 63.9 113.2 350.1 61.E + Interest Expense, Net 24.4 38.9 57.9 79 4 115.7 99.6 65 5 50.2 Interest Expense 301 39.5 58.1 876 121.2 105.2 710 6913 Interest Income 0.7 0.6 0.2 8.2 5.5 5.6 55 9.1 . Foreign Exchangess 19 2.6 76 -43 -3.1 -04 . (Income) Loss from Ainitiates -0.8 -10 -1.5 -0.B -3.0 -25 + Other Non-Op [Income) Loss -35 -59 5 3.B 154.4 27 4.1 Pretax Income [Loss), Adjusted 2417 318.5 328.1 3927 59013 -324.2 -38.7 102.7 443.6 648 9 - Abnormal Losses (Gaines) 20.5 140.4 1106 271.6 816.7 -175. -175.E + Merger/Acquisition Expense 20 3.7 23.9 45.0 20.5 - Abnormal Derivatives 0.9 - Disposal of Assets Early Extinguishment of Debt . Asset Write-Down 4.6 44.9 157 18 7 - Impairment of Goodwill 134 3.4 0.9 592 9 - Impairment of Intangibles 1.9 22 3.8 385 74 . GaryLoss on Sale/Acquisition . 343 174 -11 190.8 15.8 + Restructuring 137 7.2 129 131 77.6 67 2.2 . Other Abnormal Items -3.7 Pretax Income [Loss), GAAP 219.7 178. 268 3 282 1 318.7 1 140.9 137.1 279.5 443.6 648 9 Income Tax Experie (Benefit] 47.0 4.7 44.9 72.6 -102 3 48.9 613 + Current Income Tax 32 6 24.3 509 81.5 109.0 25.4 42.2 53.E Deferred Income Tax 14.4 -19.6 95.8 21.0 -35. -1273 6.7 7.7 ce 13 Earnings: 03/04/23 | EVTS > Download Models | MOOL =INF LN Equity . Actions . In Export . Settings Financial Analysis 2.DJ Informa PLC OFRS 16 2) Periods |10 Annuals Cur FAC (GEP ] Key Shots 1 1/5 1 8/5 0/F 5 Rec6 0Segments | 2 Add 1836 1 Custom !ll Profitability 10 growth 21 Credit 34 Credit Ex Operating Lessies|!: liquidity In Millions of GEP except Per Share 2012 1 2014 Y 2015 1 20305 Y 2019 Y- 2020 Y 2021 1 12 Months Ending 12/31/2012 12/31/2013 12/31/2014 12/31/2015 12/31/2016 12/31/2017 17/31/2012 12/31/2016 12/31/2020 17/31/212] IFRS 16/ASC 842 Adoption NO Ye Yes Yes Total Debt 425 3 814.6 914 8 929 9 1,535.2 1428.D 2.827_0 2,532.9 2 093.2 2072 6 Short-Term Debt 0.6 4.5 737 29 174.9 200 8 1572 Long Term Debt 4257 814.1 8411 927.9 1,3603 1.125.0 2 626 2 2 380.7 2 043.2 2022 6 Total Debt/TIZM EBITDA 2 89 2.79 8.26 261 457 2.64 4.23 2 85 5.03 Net Debty EBITDA 2 81 7.93 2 51 4.42 2.54 3.97 2.64 Total Debt/EBIT 5.56 3 90 7.71 4.08 4.94 25.16 Net Debty EBLT 6.19 135 3.76 7.46 3.93 J.19 456 14.15 EBITDA to Interest Expense 8.45 1010 3.97 11 86 851 9.32 B.27 5.92 6.EA EBITDA-CapEx/ Interest Expense 8.21 9.21 3.80 1162 8 39 9.07 7.37 8.11 -6.0B 5.52 EBIT to Interest Expense 3.83 501 -0.05 504 5.02 4.27 4 80 -4.62 133 BENITOA /Cash Interest Paid 145 9.37 4.15 13.03 9.44 10.41 10.09 640 -2.12 5.03 EBITDA-Capex/Cash Interest Paid B.21 3.97 12 76 9 31 10.13 9.74 6.27 2.16 4 04 EBIT/Cash Interest Paid 3 83 4.69 0.06 8.70 5 59 6.72 5.58 3.71 3.44 10 Cash Interest Paid 33.8 31.2 26.6 27.4 35.6 52.D 563 INE Interest Expense 33 8 29.2 27.8 39.5 58.1 87_6 105.9 3.0 60 6 Common Equity/Total Assets 45.11 43.86 42.15 413 43.46 45.04 53.23 53.94 57.33 57.59 Long-Term Debt/ Equity 52 32 68 35 68.70 13.17 50.47 40.78 37.19 33.45 Long-Term Debt/ Capital 38.41 40.59 39.18 42 22 36.54 30.76 29.51 28 44 27.11 25.07 Long-Term Debt/Total Assets 28.14 30 33 27_04 23.35 13.79 22.76 22.02 20.23 Total Debty Equity 52.43 68 39 74.27 73 33 64.06 46.56 43.39 37.19 33.45 Total Debt)Capital 38.43 40.61 42.62 42 31 41.24 39.05 3177 30.26 27.11 25.07 Total Debt/Total Assets 28.16 313% 30.39 3051 29.64 25.60 24 22 22:02 20.23 Net Debt Equity 60.62 65.70 71.14 70.63 67.90 61.60 43.79 40.04 31.87 18.8 Net Debty Capital 37.74 34.65 41.57 41 39 40.44 38.12 30.45 28 59 24.17 15.84INF LN Equity $4 Actions . In Export . Settings 20J Informa PLC OFAS 16 2) Periods|10 Annuals [ Financial Analysis Cur FAC (GEP) Key Stats | 1 1/5 0 8/5 | 49/F 5 Retica # Segments 2 Added 123G Custom 10 Brattability '10 Growth ini Credit 94 Credit Ex Operating Leaves In Millions of GBP except Per Share 2012 1 XBY 2014 Y 2015 3115 Y 2017 2018 7 2020 2021 7 12 Months Ending 17/31/2012 12/31/2013 12/31/2014 12/31/2015 12/31/2016 12/31/2017 12/31/2012 12/31/2015 12/31/2021 12/31/202] IFRS 16/ASC 842 Adoption Nc Nc YES Total Debt 426 3 814.6 9148 929 9 1,535.2 1428.0 2.827_0 2,849.5 2 374.D 2 238 5 Short-Term Debt 06 0.5 737 20 174.9 2008 186.4 13.4 30 0 Long Term Debt 814. 8411 927 9 1,3603 1 125.0 2 626.2 2,663.1 2,340.6 2.258 5 Total Debt/TIZM EBITDA 2 89 2.79 2 61 457 2.64 3.06 5.24 Net Deby EBITDA 281 2.68 7.93 251 4.42 2.54 3.97 2 85 8.21 Total Debt/EBIT 5 56 3.90 7.71 4.08 7.64 5.40 25.20 Net Debt/EBIT 6 19 5.35 7 45 7.19 5 03 15.45 EBITDA to Interest Expense B.45 10 01 3.97 11.86 851 9.32 J.64 -4.83 5.15 EBITDA-CapEx/ Interest Expense B.21 3.80 11 62 8 39 9.07 737 7.54 49 6.05 EEIT to Interest Expense 3.83 501 -0.06 7.92 5.04 5.02 4.27 4.35 8.39 128 BENITOA/Cach Interest Paid 8.45 9 37 4.15 13.03 10.41 10.09 6.74 -1.95 5.45 BENITOA-Capex/Cash Interest Paid B.21 9.18 3.97 12 76 931 10.13 9.74 6 61 -2.00 5.37 EEIT/Cash Interest Paid -0.05 8.70 5 59 5.72 5.50 3.81 -3.40 114 Cash Interest Paid 31.2 26.6 27.4 35.6 52 0 59.7 Interest Expense 33 8 29.2 27.8 39.5 58.1 1217 105 3 Common Equity/Total Assets 45.11 43.86 42.15 413 43.46 45.04 53.23 52 61 56.09 55.45 Long-Term Debt/Equity 62 32 58 70 73.17 62 15 50.47 45.62 41.59 37.36 Long-Term Debt/Capital 38.41 40 59 39.18 47 22 36 54 30.76 29.51 30.65 29.25 27.10 Long-Term Debt/Total Assets 28.14 30.33 27_04 23.35 23.79 24 83 24.09 22.15 Total Debt/Equity 6243 68 39 74.27 73 33 64.06 46.56 48 81 42.18 37.85 Total Debt/Capital 38.43 40.61 42.62 42 31 417 39.05 3177 29.67 27.45 Total Debt/ Total Assets 28 16 30 03 31.34 30.39 3051 29.64 25.60 26 57 24.43 12 44 Net Debty Equity 50.62 65.70 71.14 70.63 67-90 61.60 43.79 45.47 Net Debt) Capital 36.86 23.22 37.74 39.65 41.57 41 39 40.44 38.12 30.45 31.26 26.93INF L GB 1 552 00 -4.60 * ^ . L551.6 ,552. 001 1528 1918 T At 10:48 Vo 999,107 0 556 .20 H 558.60 L 548.20 va 551.397 INF LN Equity $4 Actions . In Export . )Settings Financial Analysis 20J Informa PLC OFRS 16 2) Periods 10 Annuals Cur FAC (GEP)] key Shits |2 1/5 0 8/5 | 40/F 8 Recs Segments 2 Ack:1 1 236 1 Custom 10 Profitability 10 Growth in Credit 84 Credit Ex Operating Lenses Yield Analysis Wl Dupont Analysis In Millions of GBP except Per Share 2013 Y 2014 Y 2015 7 2016 Y 2017 Y 2018 7 2019 Y- 2020 Y 2021 1 12 Months Ending 17/31/2012 12/31/2013 12/31/2014 12/31/2015 12/31/2016 12/31/2017 12/31201 12/31/2015 12/31/2020 12/31/20] Tax Burden Net Inc to Comry/Pre-Tax Profit & 128 84 -5.63 167.95 78.02 96 29 115.89 73.70 70.76 91.38 56.82 Adjustment Factor Normled Net Inc/Net Inc to Cmn 2 27 107 165 0.85 147 273 0.79 Interest Burden Pre-Tax Profit/EBIT 67.56 79 81 917.$5 87 95 82.20 76 31 72.45 110.16 65.83 Operating Margin EBIT/Revenue 939 12 80 -0.30 20.61 19.58 15.60 15.27 -62 36 11.57 Asget Tumover Revenue/Avg Assets 0 37 0.40 0.40 0.41 0 33 0.36 0.16 0.18 Leverage Ratio Avg Assets /Avg Equity 2 35 2.33 241 178 Adjusted Return on Equity 15 3 12 98 14.45 14.70 16.44 12.05 753 8.72 4.91 110 4 5 Year Average Adj ROE 10.60 1.49 1.15 13.45 14.76 14.12 13.03 11 89 7.96 4.46 Payout Ratio 139.00 110.75 76.02 83 34 54.22 131.86 124 30 Sustainable Growth Rate -127 0.06 3.29 116 5.46 -164 -0.95 139INF LN Equity 4 Actions . In Export . Settings Financial Analysis 23J Informa PLC OFRS 16 2) Periods |10 Annuals Cur FAC (CEP) 1 key Shits | 2 1/5 | 38/5 | 4/F 5 Ret c6 0 Segments 2 Ack. 1 236 Custom 10 Profitability IN Growth Of Credit , Credit Ex Operating Lowes Yield salyers I DuPont A eyeis In Millions of GBP except Per Share 2012 1 2014 Y 2015 1 2015 1 2017 Y 2018 7 2019 Y- 2020 Y A TZOZ 12 Horths Ending 12/31/2012 12/31/2013 12/31/2014 12/31/2015 12/31/2016 12/31/2017 12/31/2014 12/31/2014 12/31/2020 12/31/2021 1 Year Growth Revenue -12 91 175 0.62 5.61 10.94 30.64 34.89 2198 -42 5A 8.30 EBITDA -1 14 2.42 272 09 5.80 61.04 Z3.57 39 30 Operating Income -114 12 95 -16 52 75.59 5.79 42 59 Net Income to Common 20.29 -706.15 0.06 81.Z2 -33.11 8.47 EPS Diluted 20.00 -681.82 -2.90 59.32 -47.61 -9.64 EPS Diluted before X0 24.00 1032 290 59.32 -47.61 -9 64 EPS Diluted before Abnormal 49 38 -20. 67 6.1 -16 50.03 -17.75 -10.12 37 54 78.60 Dividend per Share 10.12 2.15 2.12 4.15 5.96 7.09 160 Accounts Receivable -13.95 -16 85 8.26 53 04 -15.47 279 20 09 -14.10 4.34 Inventory 12 60 10.4 5.45 3.37 13.91 3.24 -5.91 -24 35 -18.70 12.45 Fixed Assets -2.03 -1451 6.08 -114 34 31 31.95 119.12 396.99 -23.38 7.57 Total Assets 4 50 7.56 7.62 4 83 64.44 -4.26 129.26 -2.90 -4 38 4 04 Modified Working Capital -16.11 -10102 11.54 5.08 34.73 -22.65 -24.70 33.57 3.09 -29.61 Working Capital 19.16 8197 -28.55 8.52 -73.70 -17.46 -24.12 -5.76 41.42 24.80 Employees -13.85 7.52 14.94 45.91 158 -2.05 -8.23 Accounts Payable 28.08 -19 21 -10.37 -3.74 40.86 72 01 -15.42 -37.17 96.17 Short-Term Debt 714 16.67 14,640.00 97.29 8,645.00 73.24 -33.73 -82. DB -10.18 Total Debt 214 142 12.30 165 65.09 -6.98 46 26 D.BO -16.69 -3.60 Total Equity -411 -10 01 3.41 72 53 1.88 172 39 -3.85 3.60 7.43 Capital -180 -6.71 7.02 240 -1.17 143 33 -2.37 -7.89 4.15 Book Value per Share 4 47 -10.27 3.80 47.75 1.42 74.4 402 -19.49 5.56 Cash From Operations 10 34 -13.15 8.48 35.47 0.69 28.85 12 51 48.46 Capital Expenditures 3.90 -26 25 -18.64 50.DO -36.11 219.57 59.18 -25.21 35.51 Net Change In Cash 50.00 -53.66 1.27 858.75 -B.47 48.58 451.27 Free Cash Flow 19 91 -12.75 9.20 35.18 150 25.21 10.87 5217 Cash Flow to Firm 477 46 93 Free Cash Flow to Firm 5.61 50_09 5 Year Growth Revenue -0 33 2.43 -1.43 -0.23 107 9.51 15.95 2051 5.50 EBITDA 0.75 -191 -18.08 189 3.09 13.65 18.00 53 18 5.37INF LN Equity 34 Actions . In Export . . Settings [ Financial Analysis 1 80 Informa PLC OFAS 16 3) Periods|10 Annuals Cur FAC (GEP) Segments IL Profitability It growth Of Credit 9 Credit Ex Operating Deuces |19 Liquidity Is Working Capital To Yield Analysis In Decent # Lysis In Millions of GEP except Per Share 2012 1 20BY 2014 Y 2015 1 2015 1 2017 Y 20119 Y- 2020 Y 2021 7 12 Months Ending 12/31/2012 12/31/2013 12/31/2014 12/31/2015 12/31/2016 12/31/2017 12/31/2012 12/31/201 12/31/2020 17/31/202] Cash Ratio 0.04 .06 0.06 0105 0.05 0.11 0.12 0.25 D.66 Current Ratio 0.49 051 0.47 0.50 0.47 0.41 0.47 D.46 0.58 D.94 Quick Ratio 0.32 031 0.29 030 0.28 0.23 0.25 D.28 0.43 0.82 CFO/Avg Current Lieb D.41 0.41 0.51 0.40 0.40 0.37 D.47 0.10 0.38 Common Equity/Total Assets 45.11 43.83 42.15 4132 43.46 45.04 53.23 2 61 56.09 56.45 Long-Term Debt/ Equity 62 32 68 35 68.29 73.17 62.18 50.47 3.25 45.62 41.59 37.36 Long-Term Debt/Capital 38.41 40.59 39.18 42 22 36 54 30.76 29.51 30.65 29.25 27.10 Long-Term Debt/Total Assets 28.14 30 02 30 33 27_04 23.35 23.79 24 83 24.09 22.15 Total Debty Equity 62.43 74.27 73 33 70.17 64.06 46.56 48 81 42.16 37.85 Total Debt) Capital. 38.43 42. 52 42 31 4174 34.0 3137 29.67 27.4 Total Debt/ Total Assets 28.16 30 0 31.34 30.39 3051 29.64 25.60 26 57 24.43 2744 CFO/Total Liabilities 16.29 14.97 14.64 11.85 16.77 9.82 1484 -3.43 1156 CFO/Capex 3279 38 59 51.46 45.47 73.24 29.53 20.87 41 43 -13.11 59.57 Altman's Z-Score 15.24 153 13.73 15.57 11.08 13.66 B.90 8.01 1.84 4.18 Total Line of Credit 525 0 625.0 900.D 900 0 900.D 855.D 255 0 900.D 1.050.D 1050 0 Total Available Line of Credit 245.1 251.1 444 8 5409 594.8 567 7765 843.1 1.050.0 1050 0 Total Credit Lines Drawn 379.9 373.9 455.2 359.1 300.2 247.6 78 5 56.9 D.DINF LN Equity 34 Actions . In Export . Settings ADJ Informa PLC FAS 16 2) Periods|10 Annuals Cur FRIC (GEP] Financial Analysis key Stats |2 1/5 3 8/5 4 0/F 5 R8706 0Segments 1 Profitability 18 Brawith @ Credit 24 Credit Ex Operating Leaves In Millions of GEP except Per Share 2012 1 XBY 2014 Y 2015 2015 Y 12 Months Ending 2018 7 2019 7- 2020 Y 2021 1 12/31/2012 2/31/2013 12/31/2014 12/31/2015 12/31/2016 12/31/2017 12/31/2012 12/31/2016 12/31/2020 12/31/20] Returns Retum on Common Equity 5.70 -052 4.35 9.93 14.11 5.14 3.91 Return on Assets -18.50 139 3.02 -073 -1.85 5.73 474 Retum on Capital 6.31 262 2 07 535 -10.20 D.78 0.94 -1.41 9.04 7.16 Return on Invested Capital 9.76 4.63 3.85 -11.43 164 6.23 6.20 0.85 9.65 452 -9.04 0.90 Margins Gross Margin 68.05 6787 67.70 68.85 69.42 EENITDA Margin 67.05 25.71 66 05 68.25 58.61 9.72 29 44 25.00 30.82 Operating Margin 11 67 -30.57 24.38 12 96 -0.14 19.67 1481 19.90 Incremental Operating Margin 15.61 18 74 -53.13 5.06 -0.91 85.60 319.21 Pretax Margin 36.53 3.31 634 30.24 10 21 -114.66 705.73 -2.74 18.12 1324 15.27 Income before X0 Margin 11 91 11 03 B.44 -68.70 9.12 J.62 -4.49 14.35 12 89 17.83 9.35 Net Income Margin 851 -62.54 4.90 -058 -4.61 14.14 12.75 Net Income to Common Margin 17.69 8.77 -62.77 B.17 4.33 -058 -4.61 14.14 1275 17.69 8.77 -62.77 4.33 Additional Effective Tax Rate 10.75 21 39 2 64 2145 Dvd Payout Ratio 22 7E 119.00 35.67 110.75 75.02 58 34 54.22 Sustainable Growth Rate 131 86 124.30 -127 D.DO .06 3.29 116 5.46 -164 -0.95 13920J Informa PLC OFAS 16 2) Periods|10 Annuals Cur FAC (GEP] I Segments Custom It Browth Li credit 54 Credit Ex Operating Levees If liquidity 18 Working Capital | Ved Welais In Milions of GEP except Per Share XBY 2014 Y 2015 1 2018 7 zin19 Y's 2020 Y 2021 12 Months Ending 17/31/2012 12/31/2013 12/31/2014 12/31/2015 12/31/2016 12/31/2017 12/31/201: 12/31/2016 12/31/2020 17/31/202] Accounts Receivable Tumover 7.30 7.77 7.82 6.73 1143 12 50 7.09 8.13 Days Sales Outstanding 60.21 49 99 45.97 46.69 54.40 46.35 31 92 29 20 51. 66 44.89 Inventory Tumover 9.84 9.03 8.47 B.34 8.44 10.09 14.87 21.95 15.11 19.24 Days Inventory Outstanding 37.20 40.41 43.09 43.74 3.35 36.17 24.54 16 63 24.72 18.97 Accounts Payable Turnover 3 93 10.00 11.86 10.95 9.19 8.33 8.90 6.40 6.04 Accounts Payable Tumover Days 36.85 36.49 30.72 33.41 34.72 43.39 41 02 57.18 60.44 Cash Conversion Cyde 60.55 53.91 59.36 62 65 6435 42.81 12 67 480 18.70 3.42 Inventory to Cash Days 97.41 90.40 90.06 90.43 97.76 82 53 56.47 45 82 75.86 63.86 Total Inventory 38 2 42.2 445 46.0 52:4 541 509 38.5 313 274 Inventory Raw Materials 0.4 0.0 0.1 0.1 0.0 D.D Inventory In Progress 41 73 7.6 7.4 7.9 113 8.2 6.2 79 79 Inventory Finished Goods 337 34.9 36.8 38 5 44.5 42 8 427 323 195 Other Inventory 0.0 DO 0.0 D.D 0.0INF L GB | 4 551 80 -4.80 * ^ _ 1551.6 ,552 . 0013653567 T At 15:48 Vo 998 ,540 0 556.20 H 558.60 L 548.20 V3 551. 084 INF LN Equity 19 Actions . "h Export . 14 Settings Financial Analysis 20 Informa PLC OFRS 16 2) Periods It Annuals Cur FRC (GEP)] Add 296 4 Custom 10 Profitability 10 Growth G Credit 04 Credit Es Operating Leaves 18 liquidity le Working Capital Of Field Aralysis In Millions of GRP except Per Share 2014 1 2015 Y 2016 Y 2017 1 X118 Y 2020 7 2022 Y EST 2023 Y EST 12 Months Ending 12/31/2014 12/31/2015 12/31/2016 12/31/2017 12/31/201: 12/31/2019 12/31/201 12/31/2021 12/31/202 112 Cash Flows to Equity 4 + Cash From Operations 247_0 334.6 336.9 4341 725.1 480.C 652 0 + Capital Expenditures -48 -7.2 -46 -147 3.4 -175 Free Cash Flow 2427 327.4 3323 419.4 707 6 -1510 473.1 365.8 561 6 t Capnalization 3,055.2 3,978.0 5.603.2 5.948 3 10,727.9 7,765.1 Free Cash Flow Yield B.45 6.73 7.0.5 7.01 6.56 -104 6.10 Dividends Paid -1140 -125.0 -1619 -162 0 -260.9 -280.D -02 Net Share Repurchases 2047 -0.4 -10 -09 0.0 -15.9 972.4 27 Net ST Debt Repayments Net LT Debt Repayments 5:19 -3.7 433.0 25.4 373 -634.1 553.2 -343 Other Financing Activities -29 -4.9 7741 -48 848.1 377.J 57.4 -10.6 T12 Cash to Suppliers of Capital -195.0 1074.2 -1423 -552 3 361 6 47.6 Harket Capitalization 3,055.2 3,978.0 5.603.2 5.949 3 10727.9 8 246.7 7,765.1 T12 Shareholder Yield 472 390 19.17 2 39 3.35 5.15 D.61 - Dividends Paid -1140 -125.0 -1310 -162 0 -260.9 -280.0 0.0 - Net Share Repurchases 2041 -0.4 -10 -0.9 -159 972.4 -27 T12 Cach to Shareholders -90.1 136.4 1329 162 9 260.9 295.9 -972 2 2.7 Market Caprealization 3.055 7 3,978.0 5.603.2 5.9493 7,868.5 10,727.9 8 246.7 7,765.1 T12 Shareholder Yield, Ex Debt -2 95 3.18 2.37 3.31 2.76 -1179 112 Cash Flows to the Firm Cach From Operations 247_0 334.6 369 488.4 725.1 -1403 652 9 + Capital Expenditures 48 -7.2 4.6 147 -3.4 -17.5 -107 -6.9 + Alter-Tax Interest Expense 3.7 38 5 93.6 45.7 Trailing 124 Free Cash Flow To Firm 351.1 370.B 8012 519.E Periodic Enterprise Value 3,932 9 4.875.7 7 090.D 7.333.7 10,740.4 13,578.4 104983 9.456.9 T12 FCFF Yield 7.20 5.23 497 5.90 5 49 - Dividends Paid -1140 -125.0 -10310 162 0 -260.9 -280.D - Net Share Repurchases 2047 -0.4 -10 60- 0.0 -15.9 9724 -27 - Net ST Debt Repayments 0.0 - Net LT Debt Repayments 56.9 -3.7 754 -373 -634.1 -553 2 -343INF L GB 1 552 00 -4.60 YA - 1551.6 ,552. 001 153 3074 .T At 10:49 Vo 999,401 0 556.20 H 558.60 L 548.20 va 551.559 INF LN Equity $4 Actions . In Export . Settings Financial Analysis 28.0J Informa PLC WAS 16 2) Periods |10 Annuals Cur FAC (GEP ] Key Stats 1 1/5 18/5 46/F 9 Ratios 1 Ackal 296 Custom 10 By Measure 12 By Geography # By Segment In Millions of GEP except Per Share 2011 Y 2012 Y 2013 2015 Y 2016 Y 2017 Y 2018 7 2019 Y 2020 Y 12 Months Ending 12/31/2011 12/31/2012 12/31 2010 12/31/2014 12/31/2015 12/31/2016 12/31/2017 12/31/2012 12/31/2016 12/31/2020 Revenue 12753 100.[A 1,110.6 100.04 1,130.0 100 01 1,137.0 100.04 1,212.2 100.04 1345.7 100.04 1,7568 TOQUA 2,369.5 100_04 2 8903 100.04 16508 100.DA North America 4467 35.04 356.9 32 1% 386.8 3421 415.4 36.64 5115 42.21 6247 45.4% 239.1 53.51 1,1355 4 1357.8 47.04 846.3 51.04 Rest Of World 1382 25.54 330.4 29074 331.8 2041 336.5 29.64 321 X.X 3517 25.94 3508 20.0 436.8 18.46 585.2 287-7 China 77.1 4.4 3172 13.4 14.0% 213.6 12.94 Continental Europe 317.7 24.94 278.6 25.10 250.1 7241 235.1 20.74 215.5 17.84 2135 15.94 7367 13.5 297 8 12 64 3387 11.74 1743 10.51 LK 1727 13.5% 147 B3.04 123 HAI 149.0 13.14 143.1 11.81 1458 10.81 182.2 7.74 203.2 7.0% 1389 8.4% . Assets 3.075.7 100.04 2,934.1 100.04 2,712.2 100.04 2 918.9 100104 30598 100.CA 5,0115 100.04 4,817.1 INLA China- Including Hong Kong 92.4 20 UK 1 3256 43.14 1,3203 45.[ 1,2813 47.20 1,1302 38.74 1,2297 40.21 12969 25.94 1,386.7 28.81 Continental Europe 3160 1031 1858 631 106.4 3 01 773 2.64 547 161 64.7 14 Rest Of World 3802 124 3402 1161 358.9 13.21 3424 11.74 2795 9.14 295.6 5.94 181.4 3.81 North America 10539 3431 1,087 8 37.14 965.6 35.61 1362.0 46.94 1,495.9 48.91 3.3400 65.64 3,080.9 640 Long-Ten Assets 10,298.5 100 01 9 985.9 100104 8.9840 100.DA North America 4,4143 361 43923 4404 3 756.8 UK. 2,548.5 2471 2493.8 25.05 5.4 china 1,899.2 1 1 8624 18.74 17407 19.4% Continental Europe 1,12:3 1104 1,0421 10.46 10192 1031 Rest Of World 1953 2.04 179 0 2.04 . Capital Expenditures LIK Continental Europe Rest of World North AmericaINF LN Equity $4 Actions . In Export . Settings Financial Analysis 2.30 Informa PLC IFRS 16 2) Periods|10 Annuals Cur FAC (GEP) Key Stats | 1 1/5 1 8/5 4 0/F 9 Ratios Custom I By Measure It By Beography Es By Segment: In Millions of GBP except Per Share 20 12 Y 2013 Y 1014 7 2015 Y 2015 Y 2017 Y 2018 Y 2019 1 2021 Y 12 Months Ending 12/31/2012 12/31/2013 12/31/2014 12/31/2015 12/31/2016 12/31/2017 12/31/2018 12/31/2016 12/31/2120 12/31/2021 Revenue 1,1106 100.04 1,130.0 100.[A 1,137.0 100_04 1,212.2 100.04 13448 100.04 1,756.8 100.04 2,3695 100 0A 2,8903 100.04 1,650.8 100.04 1,798 7 100.04 . Informa Markets 1,082 2 43.61 1,437.7 42.74 524.4 31.64 608 5 33.51 . Taylor & Francis 5332 22 5% 559.6 19.41 556.0 3354 545.4 3034 . Informa Intelligence 351.1 14.81 350.7 12 10 3053 18.4% 348 3 19.4% Informa Tech 1755 7.41 256.2 1509 9.24 1659 9.21 . Informa Connect 275 117 286.1 9.94 1242 1306 734 . Gotal Exhibitions 262 5 21.74 3211 73.9% 5604 3194 . Knowledge & Networking 256.1 2274 246.2 2174 235.5 18.64 230.9 17.21 2830 15.14 Global Events 4137 37.31 1602 14.21 2002 17 61 . Academic Publishing 3403 30.61 407.8 35.14 408.9 36 0 447.4 36.94 490.4 35.54 5300 30.21 Maritime & Commodities Telecoms & Media Financial Data Analysis Finance, Insurance, Law & Tax Performance Improvement UBH Share Of Results of Joint Ventu. Humanities & Social Sciences . Business Intelligence 3586 3214 305.9 27.1% 281.7 24 81 276.8 2284 3124 22 5 383.4 2181 Revenue - Supplementary Break 14509 100.04 1,607.4 100.04 1,601.8 100 04 1212.2 100.04 1,756.8 100.0A 2,3695 LOO.(A 2,8903 100.0% 1,650.8 100.04 1,7987 100.DA Subscriptions 285.8 19.74 258.6 15.10 246.2 15.41 4613 38.74 5567 3231 587.5 24.81 560.0 72 81 642 6 41.14 688 5 3834 Exhibitor 2417 19.9% 4332 24.74 925.0 39.0 1,264.7 381 392 9 23.74 468 6 26.14 Transactional 276.0 1161 316.8 1104 299.8 18.14 3093 17.21 Marketing & Advertising Services 1892 173.0 60# 135.1 754 1241 6.94 Attendee 156.6 12.94 1772 10.14 2450 103 298.2 10 31 98.9 6.04 108 1 6.TA Sponsorship 77.0 6.4% 119 7 6.81 177.6 6 16 515 3.74 100.1 5.64 Advertising & Marketing 216 184 1820 10.41 Unit 254.0 21.04 2780 15.81 . Knowledge & Networking 256.1 15.94 246.2 15.4% . Global Events 4137 28.51 160.2 10.04 200.2 12 51 Academic Publishing 3403 23.5% 2184 13.61 218.6 1364 Advertising 180 145 0:94 10.4 061 Unit - Business Intelligence 52 8 3.64 32.8 157.6 10.94 1840 1181 1903 11 91INF L GB 1 552 00 -4.60 * A L551.6 ,551.801 467 326 .T At 10:49 Vo 999,401 0 556 .20 H 558.60 L 548.20 V3 551.559 INF LN Equity 34 Actions . In Export . Settings Financial Analysis 3 230 Informa PLC OFRS 16 :] Periods|10 Annuals Cur FAC (GEP] Hey Sets 21/5 3 8/5 49/F 9Ratios 185 Custom 10 By Measure IC E. Geography |10 By Segment In Millions of GEP except Per Share 2014 Y 2015 1 2015 Y 2017 Y 2018 7 2020 Y 12 Months Ending 12/31/2012 12/31/2013 12/31/2014 12/31/2015 12/31/2016 12/31/2017 12/31/2012 12/31/2014 12/31/2020 12/31/202] Iniona Connect Revenue 2775 286.1 1242 1306 Operating Income 135 22.2 -175.8 -19.2 Assets 615.2 384.5 27.1 463.4 Revenue Growth -56.50 5.20 Adjusted Operating Income 458 45.6 33.6 Restructuring Charges 0.2 117 Organic Growth 2 90 -55.10 3.80 Number of Employees 1.054.00 1.200_00 1,189.00 Taylor & Francis Revenue 533.2 559.6 556.0 545.4 Operating Income 1373 162 6 145.1 152 8 Assets 1 1202 1,0073 967.D S IL6 Revenue Growth * 5.00 -0.60 -190 Adjusted Operating Income 197.4 216.0 2041 Restructuring charges 67 Organic Growth 2.40 -0.20 240 Number of Employees 2,156.00 2 170_00 2,318.00 Intonna Markets Revenue 1 032 2 1,437.7 524.4 508 5 Operating Income 135 6 244.4 -597.4 Assets 5 854 7 6,737.6 6,155.1 5.992 3 Revenue Growth & 40.50 -63.50 15.20 Adjusted Operating Income 357.4 490.6 -25.J 67.4 Restructuring Charges 09 3.0 39.5 18 Organic Growth 4 30 -62.70 7.70 Number of Employees 3.558.00 5.042 00 4,730.00 Iniona Tech Revenue 175 5 256.2 1509 165 0 Operating Income 10 1 36.9 315.7 -19 8 Assets 9468 1,0843 170.1 Revenue Growth 46 00 -41.10 9.30 Adjusted Operating Income HL1 714 -19 11 2 Restructuring Charges 0.2 0.6 118 10
Step by Step Solution
There are 3 Steps involved in it
1 Expert Approved Answer
Step: 1 Unlock
Question Has Been Solved by an Expert!
Get step-by-step solutions from verified subject matter experts
Step: 2 Unlock
Step: 3 Unlock
Students Have Also Explored These Related Finance Questions!