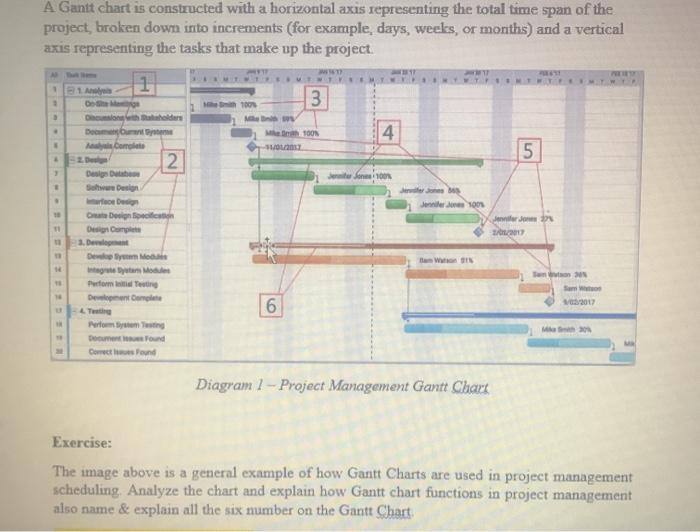
Question: A Gantt chart is constructed with a horizontal axis representing the total time span of the project, broken down into increments (for example, days, weeks,

A Gantt chart is constructed with a horizontal
A Gantt chart is constructed with a horizontal axis representing the total time span of the project, broken down into increments (for example, days, weeks, or months) and a vertical axis representing the tasks that make up the project STE 3 7001 Dodars Document Com Menu M100N SOLO 4 5 . - 2 > Dass 1001 Jer 100 Jenifer De Diction Design Complete 1. Det De M Sam 6 Performing Dentong LT Performing Domeound Coround M Diagram 1 - Project Management Gantt Chart Exercise: The image above is a general example of how Gantt Charts are used in project management scheduling. Analyze the chart and explain how Gantt chart functions in project management also name & explain all the six number on the Gantt Chart

Step by Step Solution

There are 3 Steps involved in it

1 Expert Approved Answer
Step: 1 Unlock blur-text-image
Question Has Been Solved by an Expert!

Get step-by-step solutions from verified subject matter experts

Step: 2 Unlock
Step: 3 Unlock

Students Have Also Explored These Related General Management Questions!