

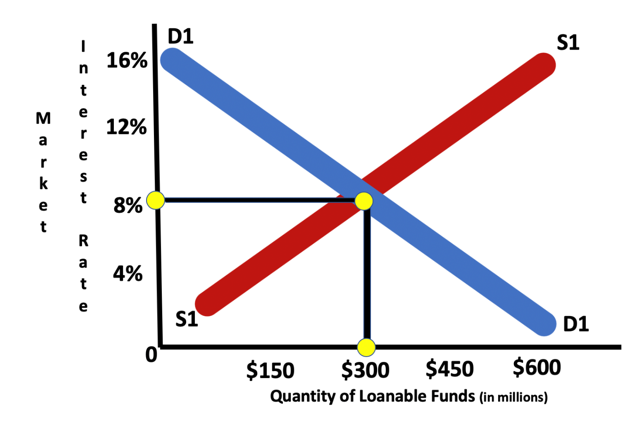
Question: A graph showing the supply, in a red straight line rising to the right, and demand, in a straight blue line descending to the right,
A graph showing the supply, in a red straight line rising to the right, and demand, in a straight blue line descending to the right, for loanable funds with the market interest rates on the vertical axis and money available on the horizontal axis. Initial equilibrium is at 8% interest rate and 300 million dollars.
Step by Step Solution
There are 3 Steps involved in it
1 Expert Approved Answer
Step: 1 Unlock

Question Has Been Solved by an Expert!
Get step-by-step solutions from verified subject matter experts
Step: 2 Unlock
Step: 3 Unlock