

Question: a. Has J&W's liquidity position improved or worsened? Explain. Current ratio Quick ratio 2021 Inventory turnover Days sales outstanding (days) Fixed assets turnover Total
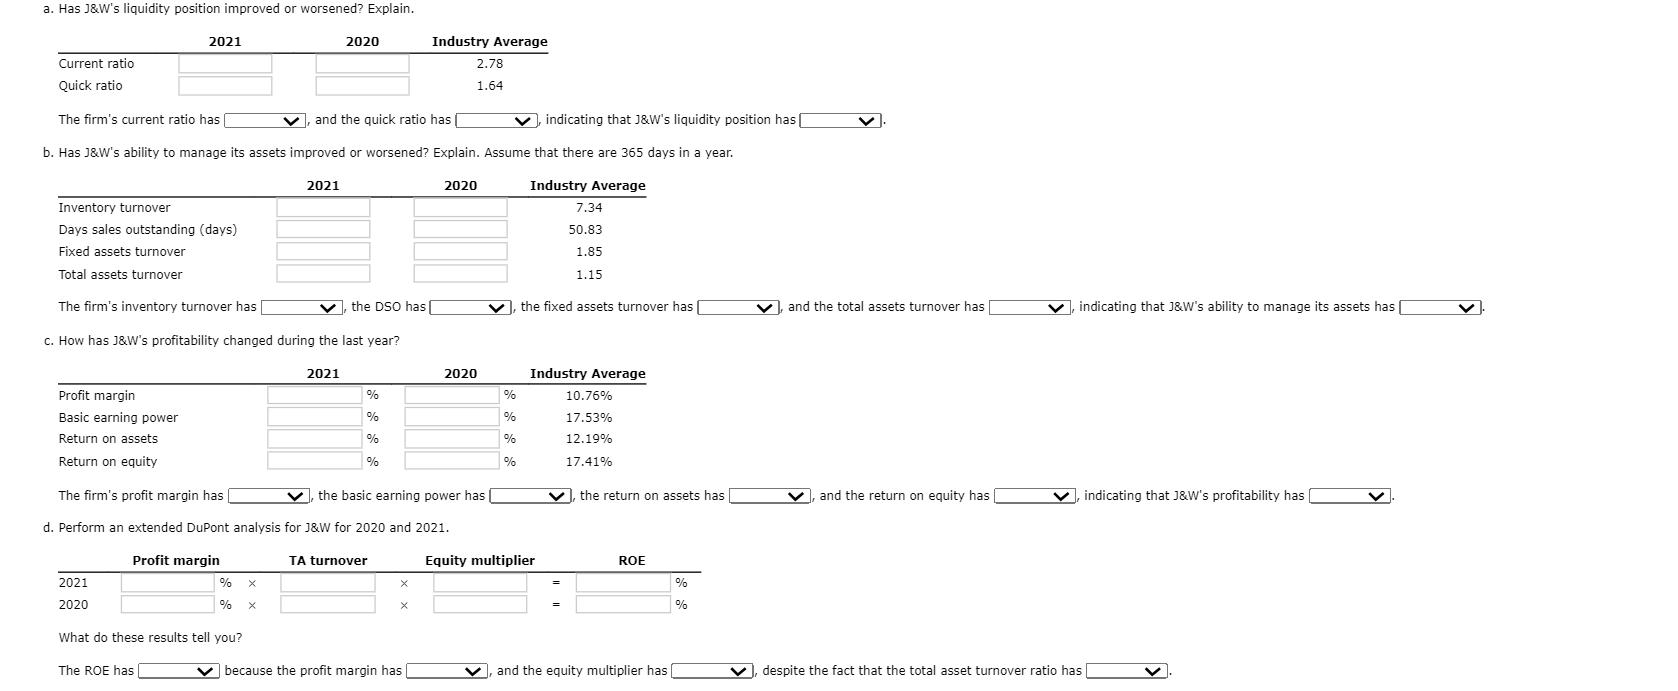
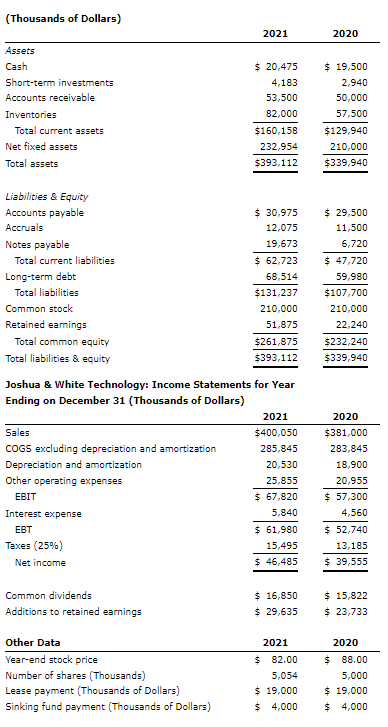
a. Has J&W's liquidity position improved or worsened? Explain. Current ratio Quick ratio 2021 Inventory turnover Days sales outstanding (days) Fixed assets turnover Total assets turnover The firm's inventory turnover has The firm's current ratio has | and the quick ratio has indicating that J&W's liquidity position has [ b. Has J&W's ability to manage its assets improved or worsened? Explain. Assume that there are 365 days in a year. 2021 2020 c. How has J&W's profitability changed during the last year? The ROE has 2021 X % % x What do these results tell you? 2020 , the DSO has 2021 Profit margin Basic earning power Return on assets Return on equity The firm's profit margin has d. Perform an extended DuPont analysis for J&W for 2020 and 2021. Profit margin % % % % TA turnover Industry Average X X 2.78 1.64 because the profit margin has [ 2020 V, the basic earning power has | 2020 Industry Average , the fixed assets turnover has % % % % 7.34 50.83 1.85 1.15 Industry Average Equity multiplier 10.76% 17.53% 12.19% 17.41% the return on assets has ROE % % V and the equity multiplier has [ , and the total assets turnover has and the return on equity has , indicating that J&W's ability to manage its assets has V indicating that J&W's profitability has despite the fact that the total asset turnover ratio has V (Thousands of Dollars) Assets Cash Short-term investments Accounts receivable Inventories Total current assets Net fixed assets Total assets Liabilities & Equity Accounts payable Accruals Notes payable Total current liabilities Long-term debt Total liabilities Common stock Retained earnings Total common equity Total liabilities & equity Sales COGS excluding depreciation and amortization Depreciation and amortization Other operating expenses EBIT Interest expense EBT Taxes (25%) Net income Common dividends Additions to retained earnings Other Data Year-end stock price Number of shares (Thousands) Lease payment (Thousands of Dollars) Sinking fund payment (Thousands of Dollars) 2021 $ 20,475 4,183 53,500 82,000 Joshua & White Technology: Income Statements for Year Ending on December 31 (Thousands of Dollars) $160,158 232,954 $393,112 $ 30,975 12,075 19,673 $ 62,723 68,514 $131,237 210,000 51,875 $261,875 $393,112 2021 $400,050 285,845 20,530 25,855 $ 67,820 5,840 $61,980 15,495 $ 46,485 $ 16,850 $ 29,635 $ 2021 82.00 5,054 $ 19,000 $4,000 2020 $19,500 2,940 50,000 57,500 $129,940 210,000 $339,940 $29,500 11,500 6,720 $ 47,720 59,980 $107,700 210,000 22,240 $232,240 $339,940 2020 $381,000 283,845 18,900 20,955 $ 57,300 4,560 $ 52,740 13,185 $ 39,555 $ 15,822 $23,733 2020 $88.00 5,000 $19,000 $4,000
Step by Step Solution
There are 3 Steps involved in it
Answer Based on the information provided we can analyze JWs liquidity position asset management and ... View full answer

Get step-by-step solutions from verified subject matter experts