

Question: Using equation (3.5) describing the Normal distribution and setting = 0 and 2 = 1, graph the distribution for the values x =
Using equation (3.5) describing the Normal distribution and setting μ = 0 and σ 2 = 1, graph the distribution for the values x = −2, −1.5, −1, −0.5, 0, 0.5, 1, 1.5, 2.
Equation (3.5)
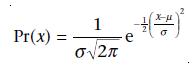
Pr(x) 1 e Ov2n
Step by Step Solution
★★★★★
3.40 Rating (163 Votes )
There are 3 Steps involved in it
1 Expert Approved Answer
Step: 1 Unlock

Using equation 35 with 0 and 21 we get the probability density function for the standar... View full answer
Question Has Been Solved by an Expert!
Get step-by-step solutions from verified subject matter experts
Step: 2 Unlock
Step: 3 Unlock