

Question: A heating curve graphically represents the phase transitions that a substance undergoes as heat is added to it. FIGURE Q1 shows a typical heating curve
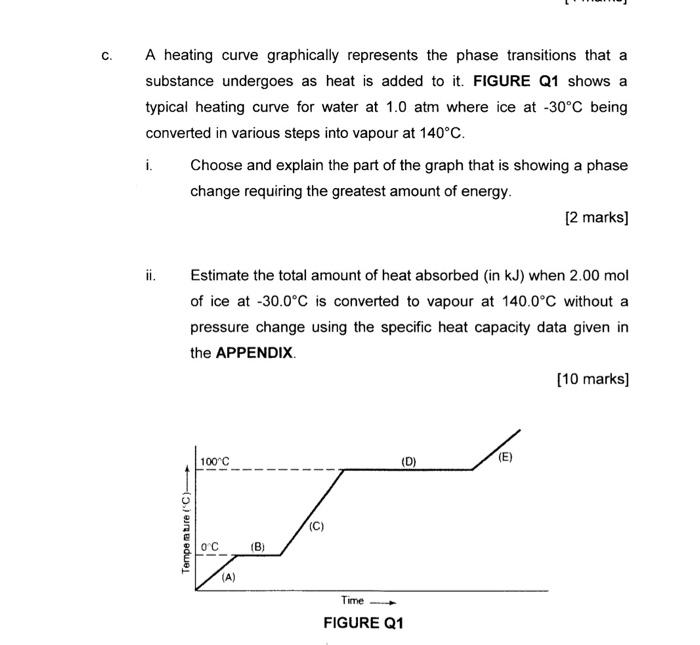
A heating curve graphically represents the phase transitions that a substance undergoes as heat is added to it. FIGURE Q1 shows a typical heating curve for water at 1.0atm where ice at 30C being converted in various steps into vapour at 140C. i. Choose and explain the part of the graph that is showing a phase change requiring the greatest amount of energy. [2 marks] ii. Estimate the total amount of heat absorbed (in kJ ) when 2.00mol of ice at 30.0C is converted to vapour at 140.0C without a pressure change using the specific heat capacity data given in the APPENDIX
Step by Step Solution
There are 3 Steps involved in it
1 Expert Approved Answer
Step: 1 Unlock

Question Has Been Solved by an Expert!
Get step-by-step solutions from verified subject matter experts
Step: 2 Unlock
Step: 3 Unlock