

Question: A high school principal has implemented a program of continuous testing on an experimental basis for ninth graders. There are 100 students who have been
A high school principal has implemented a program of continuous testing on an experimental basis for ninth graders. There are 100 students who have been tested every week for 20 weeks. The tests are comparable to each other. Following is the data for number of students who failed the test.
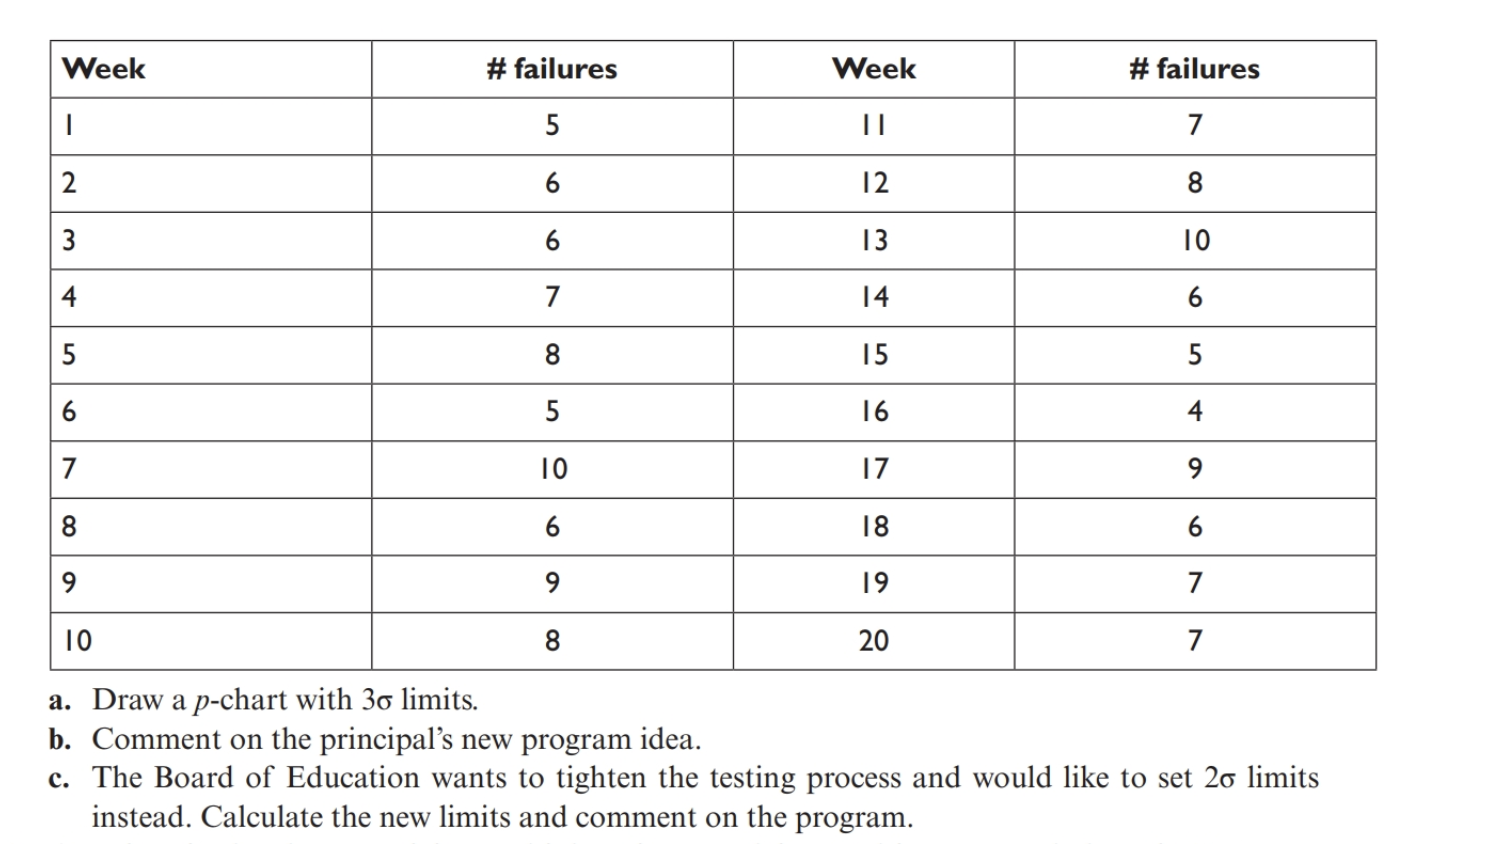
a. Draw a p-chart with 3 limits. b. Comment on the principal's new program idea. c. The Board of Education wants to tighten the testing process and would like to set 2 limits instead. Calculate the new limits and comment on the program
Step by Step Solution
There are 3 Steps involved in it
To approach this problem well start by calculating the required parameters for a pchart which are the center line upper control limit UCL and lower co... View full answer

Get step-by-step solutions from verified subject matter experts