

Question: A high school teacher started to offer a prep course for the SAT math test and would like to analyze some data to see if
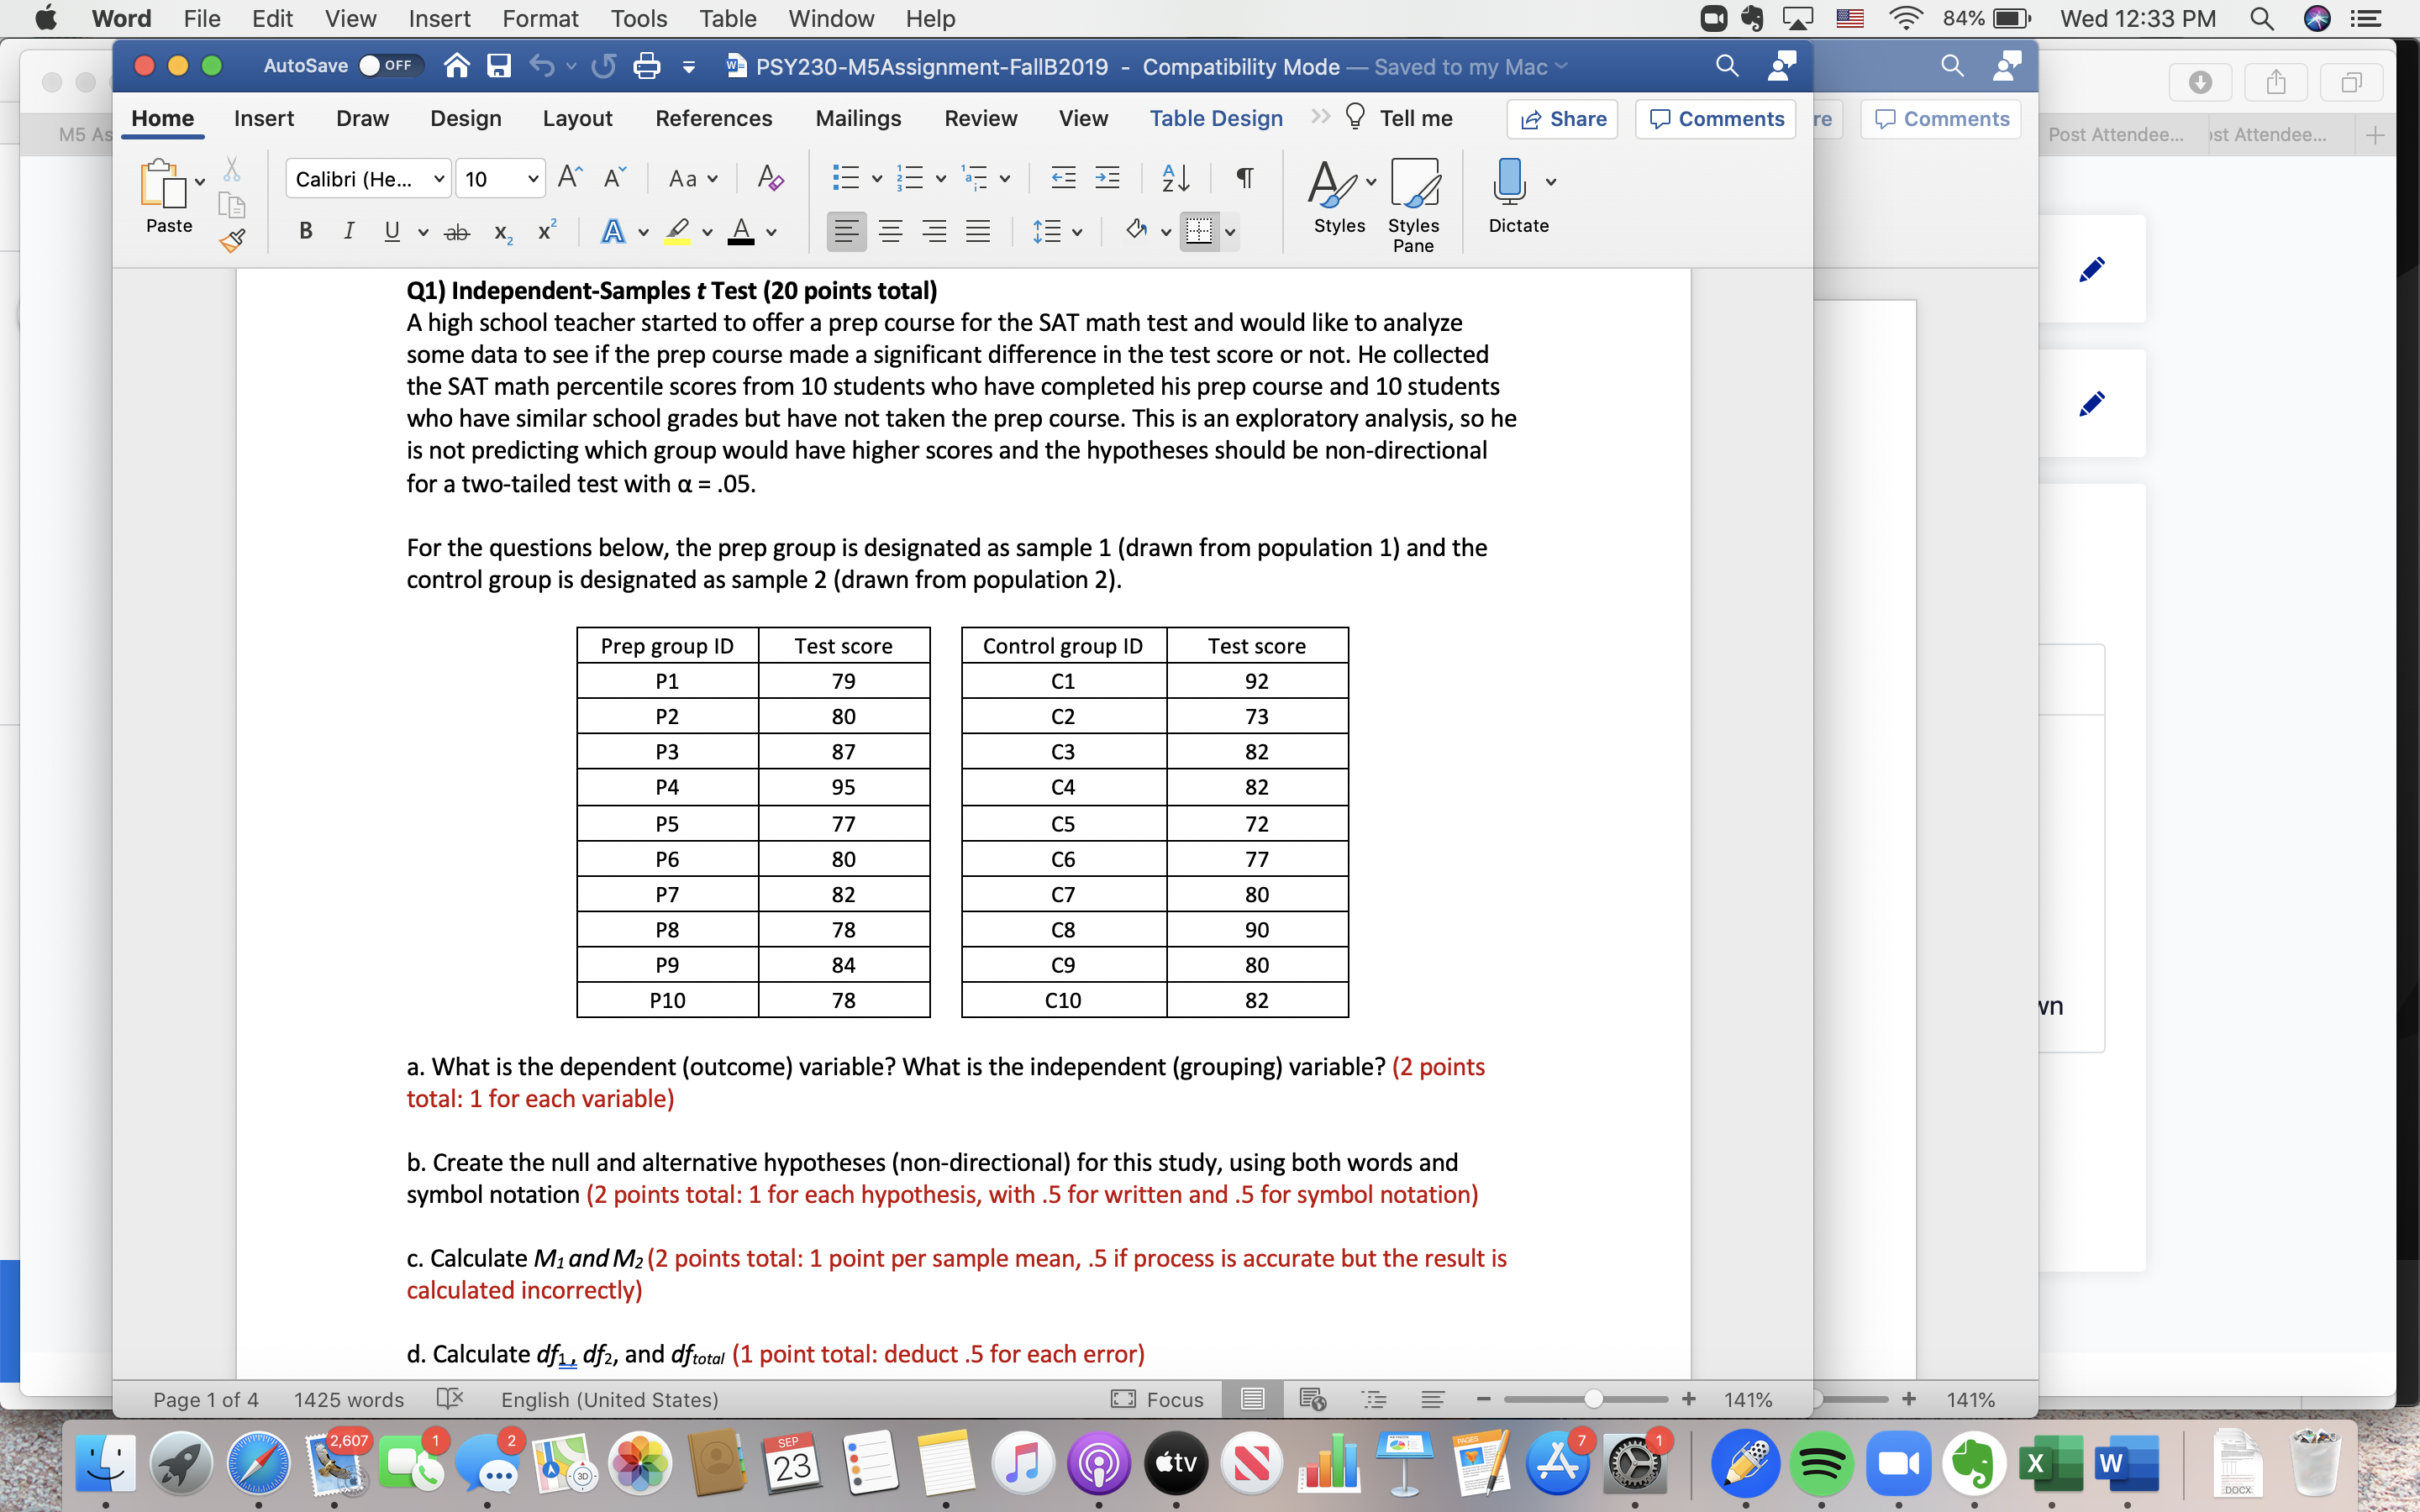
A high school teacher started to offer a prep course for the SAT math test and would like to analyze some data to see if the prep course made a significant difference in the test score or not. He collected the SAT math percentile scores from 10 students who have completed his prep course and 10 students who have similar school grades but have not taken the prep course. This is an exploratory analysis, so he is not predicting which group would have higher scores and the hypotheses should be non-directional for a two-tailed test with ? = .05.
For the questions below, the prep group is designated as sample 1 (drawn from population 1) and the control group is designated as sample 2 (drawn from population 2).
0' word I) a File Edit View Insert Format Tools Table Window Help 1; AutoSave ow {v} E :3: : E: PSYZSOeMSAsslgnmenteFallBZOlQ 7 Compatibility Mode Home Insert Draw Design Layout References Mailings Review View Table Design >> 9 Tell me .5 Share 31 [Calibri (He l1o A' A\" Aa v A '3 'T A v v v o ,_V .i_v Z) In A/V v in [a l_ .4 a Paste 6 B I 9 v ab X: x2 A t, I v A v E (I). "I' Styles Splgl'ees chtate DOC\\Esa'm as G Comments e a: Cl Comments Wed12233PM Q G 0 D\"! East Attendee\". rst Attendees\" + Q1) Independent-Samples tTest (20 points total) A high school teacher started to offer a prep course for the SAT math test and would like to analyze some data to see if the prep course made a signicant difference in the test score or not. He collected the SAT math percentile scores from 10 students who have completed his prep course and 10 students who have similar school grades but have not taken the prep course. This is an exploratory analysis, so he is not predicting which group would have higher scores and the hypotheses should be non-directional for a twotailed test with a = .05. For the questions below, the prep group is designated as sample 1 (drawn from population 1) and the control group is designated as sample 2 (drawn from population 2). Prep group ID Test score Control group ID Test score P1 79 C1 92 P2 80 C2 73 P3 87 C3 82 P4 95 C4 82 P5 77 C5 72 P6 80 C6 77 P7 82 C7 80 P8 78 C8 90 P9 84 C9 30 P10 78 C10 82 a. What is the dependent (outcome) variable? What is the independent (grouping) variable? (2 points total: 1 for each variable) b. Create the null and alternative hypotheses (non-directional) for this study, using both words and symbol notation (2 points total: 1 for each hypothesis, with .5 for written and .5 for symbol notation) c. Calculate M1 and M2 (2 points total: 1 point per sample mean, '5 if process is accurate but the result is calculated incorrectly) d. Calculate df1_, dfz, and dfmml (1 point total: deduct .5 for each error) ,O' 1
Step by Step Solution
There are 3 Steps involved in it

Get step-by-step solutions from verified subject matter experts