

Question: a. How many elements are in the above data set? b. How many variables are in this data set? c. Which variables are measured in
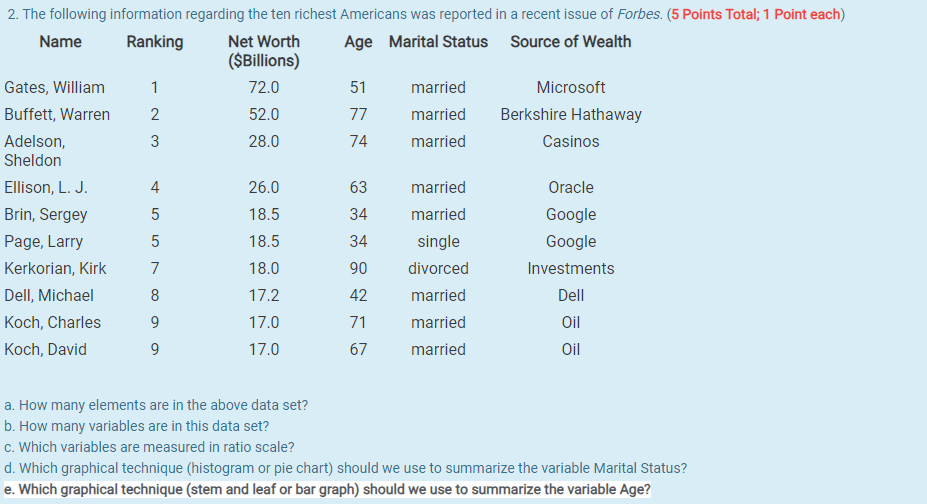
a. How many elements are in the above data set? b. How many variables are in this data set? c. Which variables are measured in ratio scale? d. Which graphical technique (histogram or pie chart) should we use to summarize the variable Marital Status? e. Which graphical technique (stem and leaf or bar graph) should we use to summarize the variable Age
Step by Step Solution
There are 3 Steps involved in it
1 Expert Approved Answer
Step: 1 Unlock

Question Has Been Solved by an Expert!
Get step-by-step solutions from verified subject matter experts
Step: 2 Unlock
Step: 3 Unlock