

Question: A https://zanestate blackboard.com/webapps/assessment /take/launch.jsp?course_assessment id=48020.18.course_ide_24148_1&content_ide_852021.1&step=null Question Completion Status: QUESTION 9 In the graph below, the area between the lines AC and OB to the right
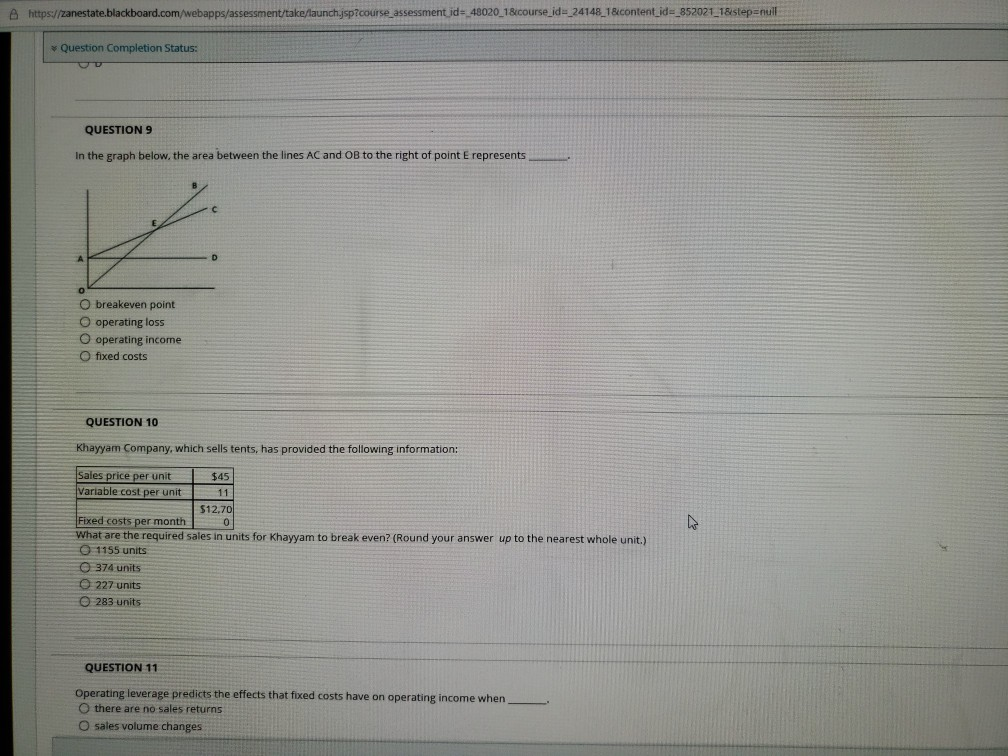
A https://zanestate blackboard.com/webapps/assessment /take/launch.jsp?course_assessment id=48020.18.course_ide_24148_1&content_ide_852021.1&step=null Question Completion Status: QUESTION 9 In the graph below, the area between the lines AC and OB to the right of point E represents Obreakeven point operating loss O operating income fixed costs QUESTION 10 Khayyam Company, which sells tents, has provided the following information: Sales price per unit $45 Variable cost per unit 11 $12.70 Fixed costs per month What are the required sales in units for Khayyam to break even? (Round your answer up to the nearest whole unit.) 1155 units 374 units 227 units 283 units QUESTION 11 Operating leverage predicts the effects that fixed costs have on operating income when there are no sales returns Osales volume changes
Step by Step Solution
There are 3 Steps involved in it

Get step-by-step solutions from verified subject matter experts