

Question: a. If exchange rates are expected as in table 2, and no plant can run below 50 percent of capacity, how much should each plant
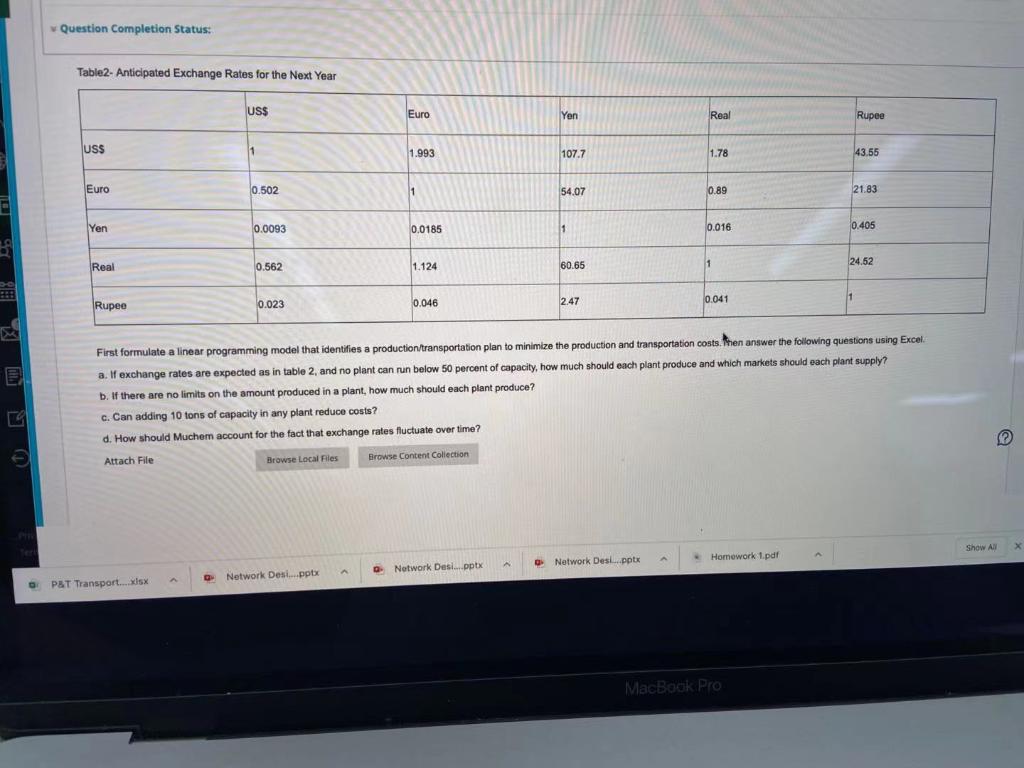
a. If exchange rates are expected as in table 2, and no plant can run below 50 percent of capacity, how much should each plant produce and which markets should each plant supply?
b. If there are no limits on the amount produced in a plant, how much should each plant produce?
c. Can adding 10 tons of capacity in any plant reduce costs?
d. How should Muchem account for the fact that exchange rates fluctuate over time?
Plz use an excel solver and object funcatioin to solve the problem
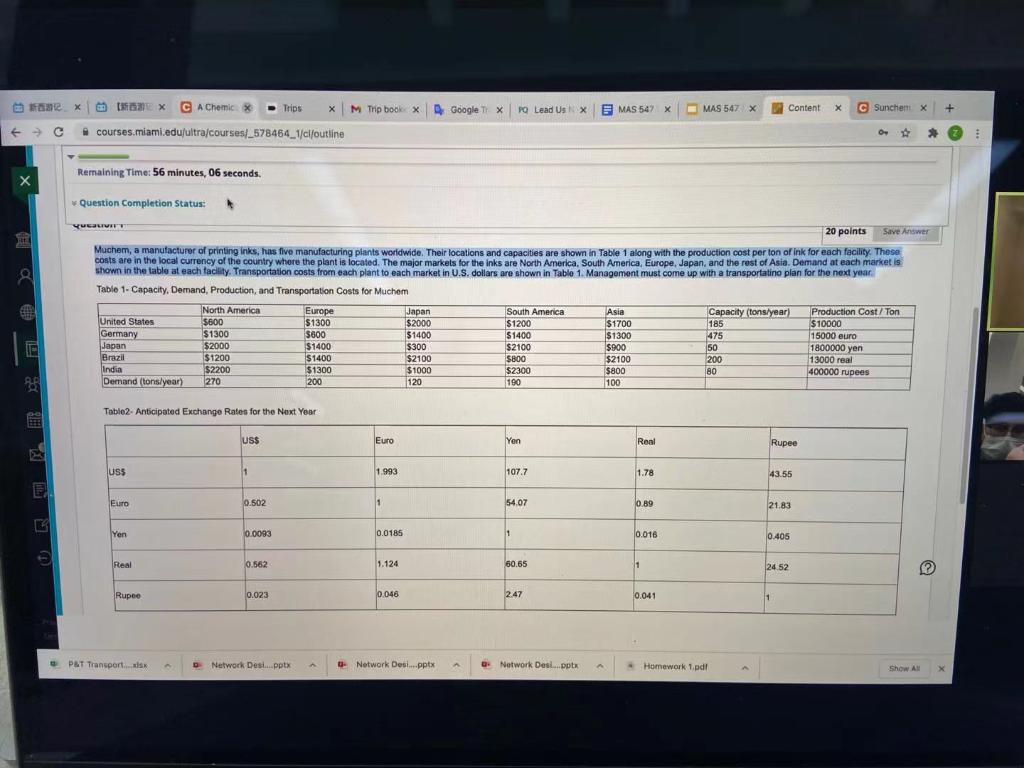
X X CA Chemic Trips X M Tripbook Google TX PO Lead UsX F MAS 542 x MAS 547 X x Content x C Sunchem x + courses.miami.edu/ultra/courses/_578464_1/cloutline Remaining Time: 56 minutes, 06 seconds. Question Completion Status: YELIFT 20 points Save Answer Muchem, a manufacturer of printing inks, has five manufacturing plants worldwide. Their locations and capacities are shown in Table 1 along with the production cost per ton of ink for each facility. These costs are in the local currency of the country where the plant is located. The major markets for the inks are North America, South America Europe, Japan, and the rest of Asia. Demand at each market is shown in the table at each facility Transportation costs from each plant to each market in U.S. dollars are shown in Table 1. Management must come up with a transportatino plan for the next year Table 1- Capacity, Demand Production, and Transportation Costs for Muchem North America Europe Japan South America Asia Capacity (tons/year) Production Cost/ Ton United States $600 51300 $2000 $1200 $1700 185 $10000 Germany $1300 $600 $1400 $1400 $1300 475 15000 euro Japan $2000 $1400 $300 $2100 $900 $ 50 1800000 yen Brazil $1200 $1400 $2100 $800 $2100 $ 200 13000 real India $2200 $1300 $1000 $2300 $800 80 400000 rupees Demand (tons/year) 270 200 120 190 100 Table2. Anticipated Exchange Rates for the Next Year 6 USS Euro Yen Real Rupee US$ 1 1.993 107.7 1.78 43.55 Euro 0.502 11 54.07 0.89 21.83 Yen 0.0093 0.0185 11 1 0.016 0.405 Real 0.562 1.124 60.65 1 24 52 Le Rupee 0.023 0.046 2.47 0.041 1 PAT Transport.sk Network Desi....pptx - Network Desi...pptx Network Desi...optx Homework 1.pdf Show All X Question Completion Status: Table2- Anticipated Exchange Rates for the Next Year US$ Euro Yen Real Rupee USS 1 1 1.993 107.7 1.78 43.55 Euro 0.502 1 54.07 0.89 21.83 Yen 0.0093 0.0185 1 0.016 0.405 Real 0.562 1.124 60.65 1 24.52 0.023 2.47 1 0.046 0.041 Rupee First formulate a linear programming model that identifies a production/transportation plan to minimize the production and transportation costs. Then answer the following questions using Excel a. If exchange rates are expected as in table 2, and no plant can run below 50 percent of capacity, how much should each plant produce and which markets should each plant supply? b. If there are no limits on the amount produced in a plant, how much should each plant produce? c. Can adding 10 tons of capacity in any plant reduce costs? d. How should Muchem account for the fact that exchange rates fluctuate over time? Attach File Browse Local Files Browse Content Collection Show All x Network Desl.pptx Homework 1.pdf A Network Desi.pptx Network Desi....pptx O PAT Transport.... Xlsx MacBook Pro X X CA Chemic Trips X M Tripbook Google TX PO Lead UsX F MAS 542 x MAS 547 X x Content x C Sunchem x + courses.miami.edu/ultra/courses/_578464_1/cloutline Remaining Time: 56 minutes, 06 seconds. Question Completion Status: YELIFT 20 points Save Answer Muchem, a manufacturer of printing inks, has five manufacturing plants worldwide. Their locations and capacities are shown in Table 1 along with the production cost per ton of ink for each facility. These costs are in the local currency of the country where the plant is located. The major markets for the inks are North America, South America Europe, Japan, and the rest of Asia. Demand at each market is shown in the table at each facility Transportation costs from each plant to each market in U.S. dollars are shown in Table 1. Management must come up with a transportatino plan for the next year Table 1- Capacity, Demand Production, and Transportation Costs for Muchem North America Europe Japan South America Asia Capacity (tons/year) Production Cost/ Ton United States $600 51300 $2000 $1200 $1700 185 $10000 Germany $1300 $600 $1400 $1400 $1300 475 15000 euro Japan $2000 $1400 $300 $2100 $900 $ 50 1800000 yen Brazil $1200 $1400 $2100 $800 $2100 $ 200 13000 real India $2200 $1300 $1000 $2300 $800 80 400000 rupees Demand (tons/year) 270 200 120 190 100 Table2. Anticipated Exchange Rates for the Next Year 6 USS Euro Yen Real Rupee US$ 1 1.993 107.7 1.78 43.55 Euro 0.502 11 54.07 0.89 21.83 Yen 0.0093 0.0185 11 1 0.016 0.405 Real 0.562 1.124 60.65 1 24 52 Le Rupee 0.023 0.046 2.47 0.041 1 PAT Transport.sk Network Desi....pptx - Network Desi...pptx Network Desi...optx Homework 1.pdf Show All X Question Completion Status: Table2- Anticipated Exchange Rates for the Next Year US$ Euro Yen Real Rupee USS 1 1 1.993 107.7 1.78 43.55 Euro 0.502 1 54.07 0.89 21.83 Yen 0.0093 0.0185 1 0.016 0.405 Real 0.562 1.124 60.65 1 24.52 0.023 2.47 1 0.046 0.041 Rupee First formulate a linear programming model that identifies a production/transportation plan to minimize the production and transportation costs. Then answer the following questions using Excel a. If exchange rates are expected as in table 2, and no plant can run below 50 percent of capacity, how much should each plant produce and which markets should each plant supply? b. If there are no limits on the amount produced in a plant, how much should each plant produce? c. Can adding 10 tons of capacity in any plant reduce costs? d. How should Muchem account for the fact that exchange rates fluctuate over time? Attach File Browse Local Files Browse Content Collection Show All x Network Desl.pptx Homework 1.pdf A Network Desi.pptx Network Desi....pptx O PAT Transport.... Xlsx MacBook ProStep by Step Solution
There are 3 Steps involved in it
1 Expert Approved Answer
Step: 1 Unlock

Question Has Been Solved by an Expert!
Get step-by-step solutions from verified subject matter experts
Step: 2 Unlock
Step: 3 Unlock