

Question: Please explain what to put in Excel for this to use excel solver Problem statement: Sunshem, a manufacturer of printing inks, has five manufacturing plants
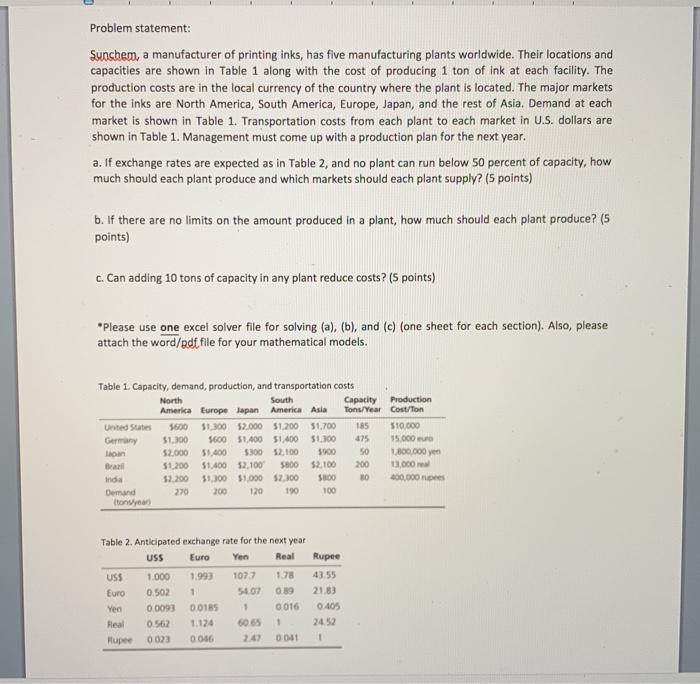
Problem statement: Sunshem, a manufacturer of printing inks, has five manufacturing plants worldwide. Their locations and capacities are shown in Table 1 along with the cost of producing 1 ton of ink at each facility. The production costs are in the local currency of the country where the plant is located. The major markets for the inks are North America, South America, Europe, Japan, and the rest of Asia. Demand at each market is shown in Table 1. Transportation costs from each plant to each market in U.S. dollars are shown in Table 1. Management must come up with a production plan for the next year. a. If exchange rates are expected as in Table 2, and no plant can run below 50 percent of capacity, how much should each plant produce and which markets should each plant supply? (5 points) b. If there are no limits on the amount produced in a plant, how much should each plant produce? (5 points) c. Can adding 10 tons of capacity in any plant reduce costs? (5 points) *Please use one excel solver file for solving (a), (b), and (c) (one sheet for each section). Also, please attach the word/adf file for your mathematical models. Table 1. Capacity, demand, production, and transportation costs United States North South America Europe Japan America Asia 5600 $1.300 52.000 $1.200 51,700 $1.300 5600 51.400 $1,400 51.100 52.000 51.400 5300 52.100 5900 51.200 $1.400 52.100 5800 52.100 12.200 51300 $1.000 2100 5800 270 120 190 100 Capacity Production Tons/Year Cost/Ton 185 510.000 475 15.000 50 1.800.000 200 13.000 HO 100.000 Loan Brazil India Demand tonya 200 Table 2. Anticipated exchange rate for the next year USS Euro Yen Real USS 1.000 1.993 1077 1.78 Euro 0.502 1 5407 Yen 0.0093 00185 1 0016 Real 0.562 1.124 6065 1 0.023 0046 0001 Rupee 43.55 21.83 0.405 2452 1 Problem statement: Sunshem, a manufacturer of printing inks, has five manufacturing plants worldwide. Their locations and capacities are shown in Table 1 along with the cost of producing 1 ton of ink at each facility. The production costs are in the local currency of the country where the plant is located. The major markets for the inks are North America, South America, Europe, Japan, and the rest of Asia. Demand at each market is shown in Table 1. Transportation costs from each plant to each market in U.S. dollars are shown in Table 1. Management must come up with a production plan for the next year. a. If exchange rates are expected as in Table 2, and no plant can run below 50 percent of capacity, how much should each plant produce and which markets should each plant supply? (5 points) b. If there are no limits on the amount produced in a plant, how much should each plant produce? (5 points) c. Can adding 10 tons of capacity in any plant reduce costs? (5 points) *Please use one excel solver file for solving (a), (b), and (c) (one sheet for each section). Also, please attach the word/adf file for your mathematical models. Table 1. Capacity, demand, production, and transportation costs United States North South America Europe Japan America Asia 5600 $1.300 52.000 $1.200 51,700 $1.300 5600 51.400 $1,400 51.100 52.000 51.400 5300 52.100 5900 51.200 $1.400 52.100 5800 52.100 12.200 51300 $1.000 2100 5800 270 120 190 100 Capacity Production Tons/Year Cost/Ton 185 510.000 475 15.000 50 1.800.000 200 13.000 HO 100.000 Loan Brazil India Demand tonya 200 Table 2. Anticipated exchange rate for the next year USS Euro Yen Real USS 1.000 1.993 1077 1.78 Euro 0.502 1 5407 Yen 0.0093 00185 1 0016 Real 0.562 1.124 6065 1 0.023 0046 0001 Rupee 43.55 21.83 0.405 2452 1
Step by Step Solution
There are 3 Steps involved in it

Get step-by-step solutions from verified subject matter experts