

Question: a) In the figure below you see a classification scheme for mineral resources. Explain the Figure focussing on the relation to the variogram and its
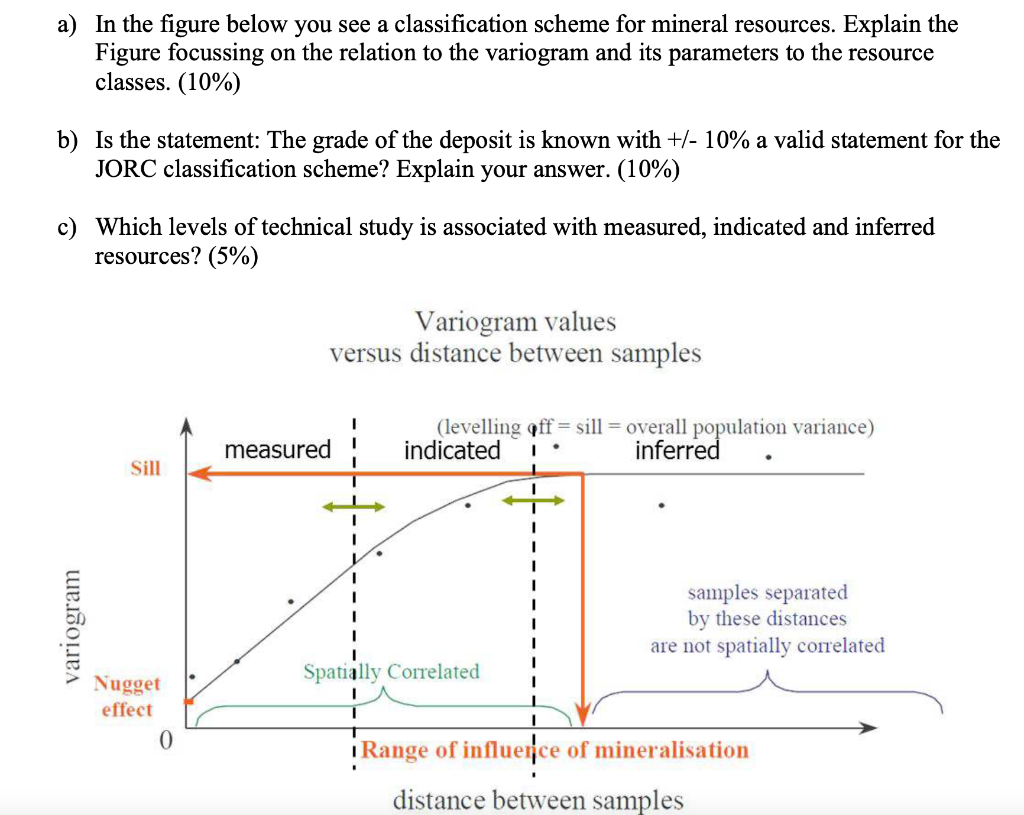
a) In the figure below you see a classification scheme for mineral resources. Explain the Figure focussing on the relation to the variogram and its parameters to the resource classes. (10%) b) Is the statement: The grade of the deposit is known with +/- 10% a valid statement for the JORC classification scheme? Explain your answer. (10%) c) Which levels of technical study is associated with measured, indicated and inferred resources? (5%) Variogram values versus distance between samples (levelling off = sill = overall population variance) indicated inferred measured 1 Sill 1 1 1 1 variogram samples separated by these distances are not spatially correlated Spatially Correlated I Range of influence of mineralisation Nugget effect 0 1 distance between samples a) In the figure below you see a classification scheme for mineral resources. Explain the Figure focussing on the relation to the variogram and its parameters to the resource classes. (10%) b) Is the statement: The grade of the deposit is known with +/- 10% a valid statement for the JORC classification scheme? Explain your answer. (10%) c) Which levels of technical study is associated with measured, indicated and inferred resources? (5%) Variogram values versus distance between samples (levelling off = sill = overall population variance) indicated inferred measured 1 Sill 1 1 1 1 variogram samples separated by these distances are not spatially correlated Spatially Correlated I Range of influence of mineralisation Nugget effect 0 1 distance between samples
Step by Step Solution
There are 3 Steps involved in it

Get step-by-step solutions from verified subject matter experts