

Question: a J t sin Precipitation 12 Problem 2 The graph below models the monthly average precipitation in inches at a town on a particular mountain
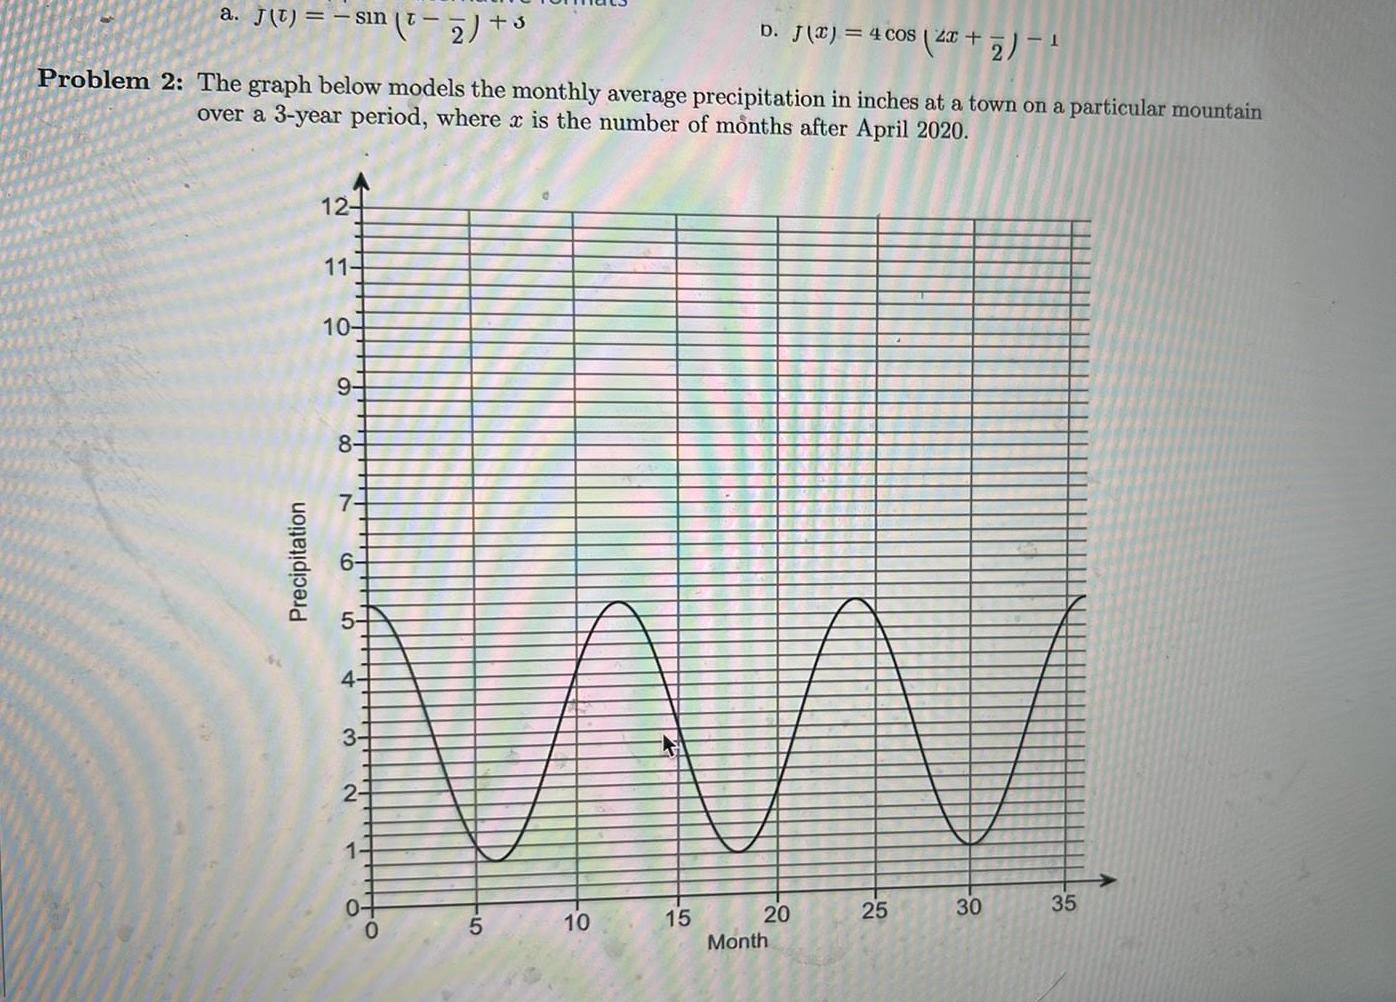

a J t sin Precipitation 12 Problem 2 The graph below models the monthly average precipitation in inches at a town on a particular mountain over a 3 year period where x is the number of months after April 2020 11 10 9 8 7 5 4 3 2 1 n 2 3 0 0 5 10 D J x 4 COS 2x 15 20 Month x 2 1 25 30 35
Step by Step Solution
There are 3 Steps involved in it
1 Expert Approved Answer
Step: 1 Unlock

Question Has Been Solved by an Expert!
Get step-by-step solutions from verified subject matter experts
Step: 2 Unlock
Step: 3 Unlock