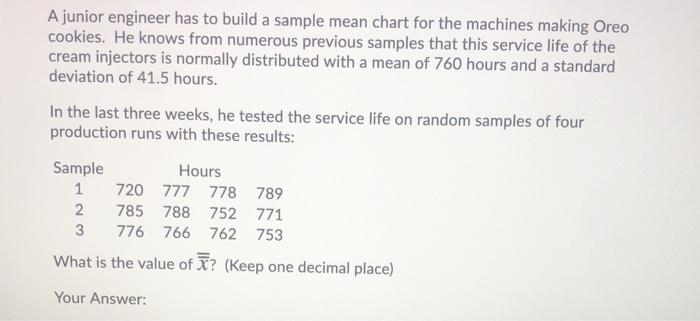
Question: A junior engineer has to build a sample mean chart for the machines making Oreo cookies. He knows from numerous previous samples that this service

A junior engineer has to build a sample mean
A junior engineer has to build a sample mean chart for the machines making Oreo cookies. He knows from numerous previous samples that this service life of the cream injectors is normally distributed with a mean of 760 hours and a standard deviation of 41.5 hours. In the last three weeks, he tested the service life on random samples of four production runs with these results: Sample Hours 1 720 777 778 789 2 785 788 752 771 3 776 766 762 753 What is the value of ? (Keep one decimal place) Your Answer: A design engineer wants to construct a sample mean chart for controlling the service life of a halogen headlamp his company produces. He knows from numerous previous samples that this service life is normally distributed with a mean of 760 hours and a standard deviation of 41.5 hours. On three recent production batches, he tested service life on random samples of four headlamps with these results: Sample Hours 1 744 754 756 787 2. 792 787 766 762 3 766 787 750 766 What is the sample mean service life for sample 3? (Keep one decimal place) Your

Step by Step Solution

There are 3 Steps involved in it

1 Expert Approved Answer
Step: 1 Unlock blur-text-image
Question Has Been Solved by an Expert!

Get step-by-step solutions from verified subject matter experts

Step: 2 Unlock
Step: 3 Unlock

Students Have Also Explored These Related General Management Questions!