

Question: A kayak is a relatively streamlined object, so as a first approximation we can assume the kayak acts as if it were a smooth, one-sided
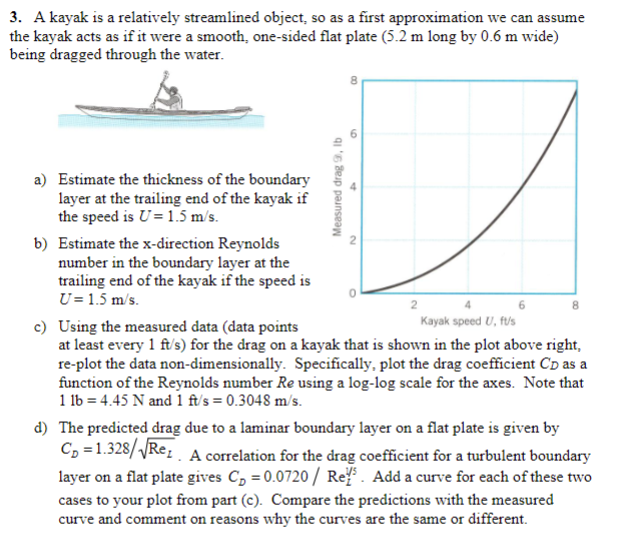
A kayak is a relatively streamlined object, so as a first approximation we can assume the kayak acts as if it were a smooth, one-sided flat plate (5.2 m long by 0.6 m wide) being dragged through the water. a) Estimate the thickness of the boundary layer at the trailing end of the kayak if the speed is U = 1.5 m/s. b) Estimate the x-direction Reynolds number in the boundary layer at the trailing end of the kayak if the speed is U = 1.5 m/s. c) Using the measured data (data points at least every 1 ft/s) for the drag on a kayak that is shown in the plot above right, re-plot the data non-dimensionally. Specifically, plot the drag coefficient CD as a function of the Reynolds number Re using a log-log scale for the axes. Note that 1 lb = 4.45 N and 1 ft/s = 0.3048 m/s. d) The predicted drag due to a laminar boundary layer on a flat plate is given by? CD = 1.328 ReL . A correlation for the drag coefficient for a turbulent boundary layer on a flat plate gives1 5 0.0720 ReD LC = . Add a curve for each of these two cases to your plot from part (c). Compare the predictions with the measured curve and comment on reasons why the curves are the same or different.
Step by Step Solution
There are 3 Steps involved in it

Get step-by-step solutions from verified subject matter experts