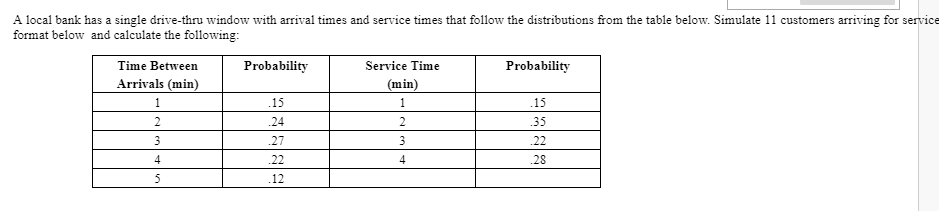
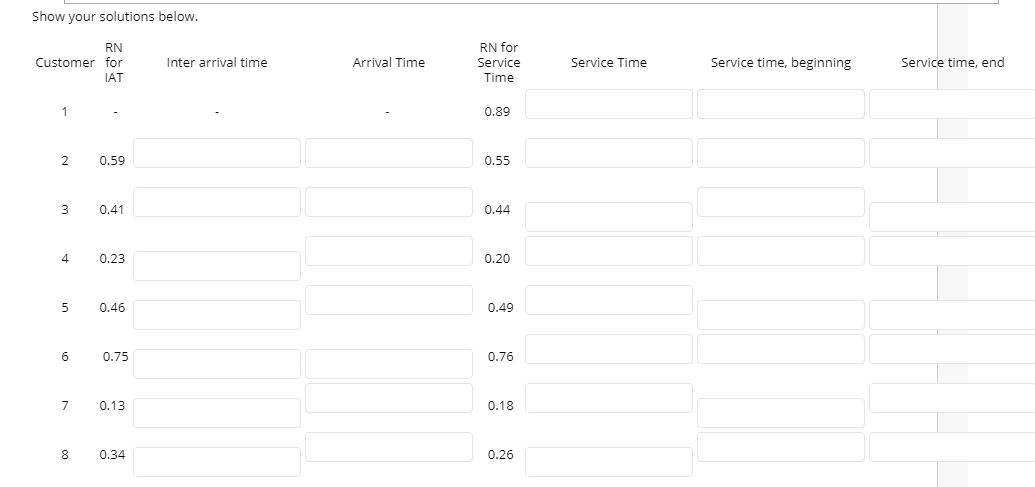
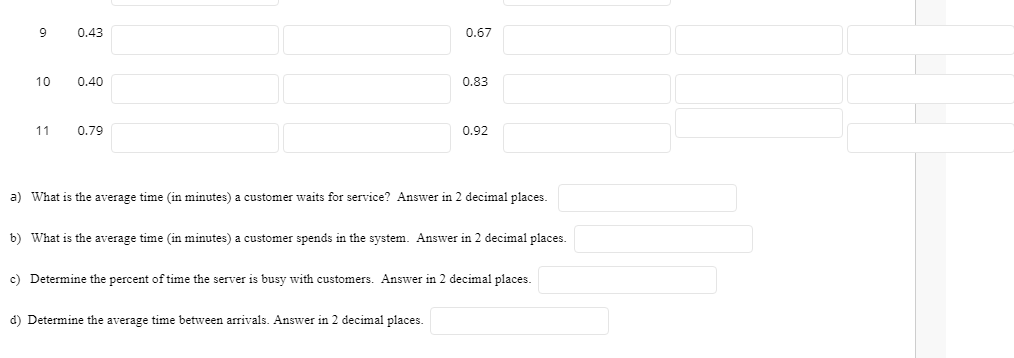
Question: A local bank has a single drive-thru window with arrival times and service times that follow the distributions from the table below. Simulate 11 customers

A local bank has a single drive-thru window withA local bank has a single drive-thru window withA local bank has a single drive-thru window with

A local bank has a single drive-thru window with arrival times and service times that follow the distributions from the table below. Simulate 11 customers arriving for service format below and calculate the following: Time Between Probability Service Time Probability Arrivals (min) (min) .15 15 .24 2 35 3 .22 4 .28 .12 2 27 22 4 5 Show your solutions below. RN Customer for IAT Inter arrival time Arrival Time RN for Service Time Service Time Service time, beginning Service time, end 0.89 2 0.59 0.55 3 0.41 0.44 4 0.23 0.20 5 0.46 0.49 6 0.75 0.76 7 0.13 0.18 8 0.34 0.26 9 0.43 0.67 10 0.40 0.83 11 0.79 0.92 a) What is the average time in minutes) a customer waits for service? Answer in 2 decimal places. b) What is the average time in minutes) a customer spends in the system. Answer in 2 decimal places. c) Determine the percent of time the server is busy with customers. Answer in 2 decimal places. d) Determine the average time between arrivals. Answer in 2 decimal places

Step by Step Solution

There are 3 Steps involved in it

1 Expert Approved Answer
Step: 1 Unlock blur-text-image
Question Has Been Solved by an Expert!

Get step-by-step solutions from verified subject matter experts

Step: 2 Unlock
Step: 3 Unlock

Students Have Also Explored These Related General Management Questions!