

Question: a. Look at Exhibit 3. Your mean and standard deviations are given in applications per hour, but we can still calculate a Coefficient of Variation.
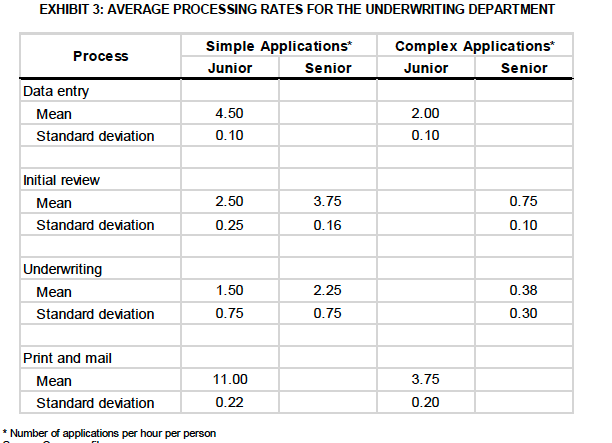
a. Look at Exhibit 3. Your mean and standard deviations are given in applications per hour, but we can still calculate a Coefficient of Variation. Calculate the ratio of standard deviation to mean processing rate. Should we consider these, in addition to utilization? If so, which other step(s) might be causing a slowdown in the process?
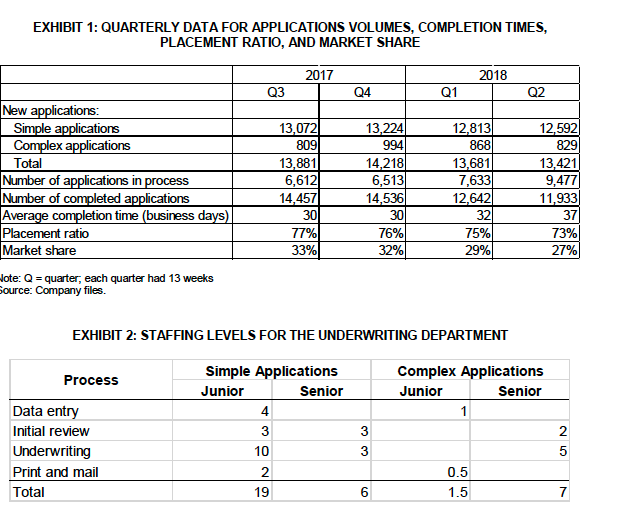
b. If there were no waiting before any of the process steps, how long would it take for an application to go through the process? How does this compare to the average time to complete an application? Why is time through the process important?
EXHIBIT 3: AVERAGE PROCESSING RATES FOR THE UNDERWRITING DEPARTMENT Process Simple Applications Junior Senior Complex Applications Junior Senior Data entry Mean Standard deviation 4.50 0.10 2.00 0.10 Initial review Mean Standard deviation 2.50 0.75 3.75 0.16 0.25 0.10 Underwriting Mean Standard deviation 1.50 0.75 2.25 0.75 0.38 0.30 Print and mail Mean 11.00 Standard deviation 0.22 * Number of applications per hour per person 3.75 0.20 EXHIBIT 1: QUARTERLY DATA FOR APPLICATIONS VOLUMES, COMPLETION TIMES, PLACEMENT RATIO, AND MARKET SHARE 2017 2018 Q3 Q4 Q1 Q2 New applications: Simple applications Complex applications Total Number of applications in process Number of completed applications Average completion time (business days) Placement ratio Market share Note: Q = quarter, each quarter had 13 weeks Source: Company files. 13,072 809 13,881 6,612 14,457 30 77% 33% 13,224 994 14,218 6,513 14,536 30 76% 32% 12,8131 868 13,681 7,6331 12,642 32 75% 29% 12,5921 829 13,421 9,477 11,933 37 73% 27% EXHIBIT 2: STAFFING LEVELS FOR THE UNDERWRITING DEPARTMENT Process Complex Applications Junior Senior 1 Simple Applications Junior Senior 4 3 10 2 19 3 Data entry Initial review Underwriting Print and mail Total 2 3 5 0.5 1.5 01 01 6 7 EXHIBIT 3: AVERAGE PROCESSING RATES FOR THE UNDERWRITING DEPARTMENT Process Simple Applications Junior Senior Complex Applications Junior Senior Data entry Mean Standard deviation 4.50 0.10 2.00 0.10 Initial review Mean Standard deviation 2.50 0.75 3.75 0.16 0.25 0.10 Underwriting Mean Standard deviation 1.50 0.75 2.25 0.75 0.38 0.30 Print and mail Mean 11.00 Standard deviation 0.22 * Number of applications per hour per person 3.75 0.20 EXHIBIT 1: QUARTERLY DATA FOR APPLICATIONS VOLUMES, COMPLETION TIMES, PLACEMENT RATIO, AND MARKET SHARE 2017 2018 Q3 Q4 Q1 Q2 New applications: Simple applications Complex applications Total Number of applications in process Number of completed applications Average completion time (business days) Placement ratio Market share Note: Q = quarter, each quarter had 13 weeks Source: Company files. 13,072 809 13,881 6,612 14,457 30 77% 33% 13,224 994 14,218 6,513 14,536 30 76% 32% 12,8131 868 13,681 7,6331 12,642 32 75% 29% 12,5921 829 13,421 9,477 11,933 37 73% 27% EXHIBIT 2: STAFFING LEVELS FOR THE UNDERWRITING DEPARTMENT Process Complex Applications Junior Senior 1 Simple Applications Junior Senior 4 3 10 2 19 3 Data entry Initial review Underwriting Print and mail Total 2 3 5 0.5 1.5 01 01 6 7Step by Step Solution
There are 3 Steps involved in it
1 Expert Approved Answer
Step: 1 Unlock

Question Has Been Solved by an Expert!
Get step-by-step solutions from verified subject matter experts
Step: 2 Unlock
Step: 3 Unlock