

Question: A M N 0 1 2 B C D G H H Case Study - 2 Ton Group is planning to establish a downstream company
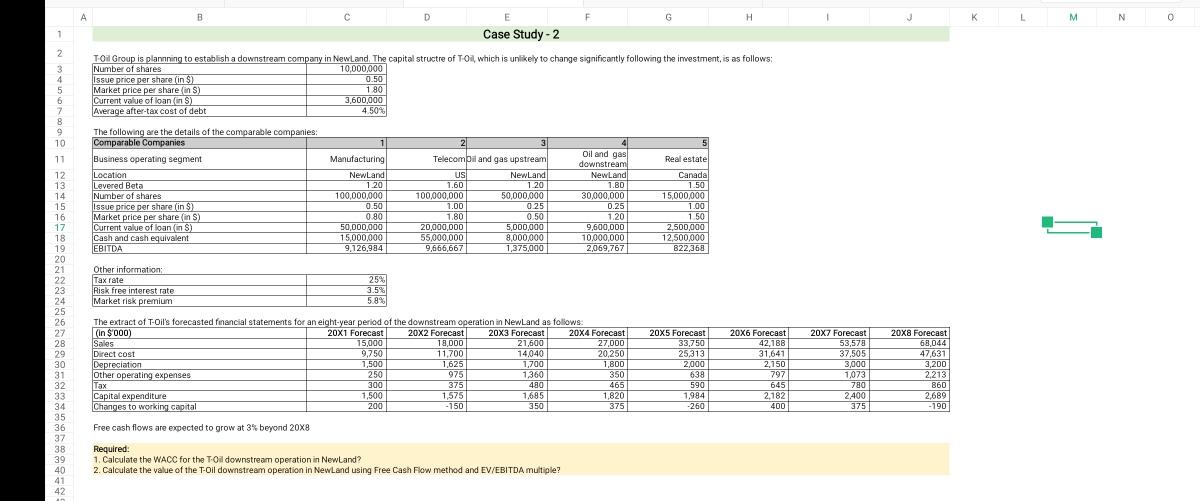
A M N 0 1 2 B C D G H H Case Study - 2 Ton Group is planning to establish a downstream company in Newland. The capital structre of Toll, which is unlikely to change significantly following the investment, is as follows: Number of shares 10,000,000 Issue price per share (in $) 0.50 Market price per share (in S) 180 Current value of loan in ) 3,600,000 Average after-tax cost of debt 4.50% 3 4 5 9 10 2 3 5 Real estate The following are the details of the comparable companies: Comparable Companies Business operating segment Location Levered Beta Number of shares Issue price per share in $) Market price per share in S) Current value of loan in ) Cash and cash equivalent EBITDA Manufacturing NewLand 1.20 100,000,000 0.50 0.80 50,000,000 15,000,000 9,126,9841 Telecompil and gas upstream US NewLand 1.601 1.20 100,000,000 50,000,000 1.00 0.25 1.80 1.09 0.50 0.00 20,000,000 5,000,000 55,000,000 8,000,000 9,666,667 1,375,000 Oil and gas downstream NewLand 1.BD 30,000,000 0.25 1.20 9,600,000 Canada 1.50 15,000,000 1.00 1.50 2,500,000 12,500,000 822,360 10.000.000 2,069,767 Other information: Tax rate Risk free interest rate Market risk premium 25% 3.5% 5.8% 11 12 13 14 15 16 17 18 19 20 21 22 23 24 25 26 27 28 29 30 31 32 33 34 35 36 37 38 39 40 41 42 The extract of T-Oil's forecasted financial statements for an eight-year period of the downstream operation in New Land as follows (in $ 000) 20x1 Forecast 20x2 Forecast 20x3 Forecast 20x4 Forecast Sales 15,000 18,000 21,600 27,000 Direct cost 9.750 11.700 14.040 20,250 Depreciation 1,500 1,625 1,700 1,800 Other operating expenses 250 975 1360 350 Tax 300 3751 480 465 Capital expenditure 1,500 1.575 1,685 1,820 Changes to working capital 2001 -150 350 375 20X5 Forecast 33,750 25,313 2,000 638 590 1.984 -260 20X6 Forecast 42,188 31,641 2,150 797 645 2,182 400 20X7 Forecast 53,578 37,505 3000 1073 780 2.400 375 20X8 Forecast 68,044 47,631 3,200 2,213 860 2,689 -190 Free cash flows are expected to grow at 3 beyond 20x8 Required: 1. Calculate the WACC for the T-Oil downstream operation in Newland? 2. Calculate the value of the T-Oil downstream operation in New Land using Free Cash Flow method and EV/EBITDA multiple? A M N 0 1 2 B C D G H H Case Study - 2 Ton Group is planning to establish a downstream company in Newland. The capital structre of Toll, which is unlikely to change significantly following the investment, is as follows: Number of shares 10,000,000 Issue price per share (in $) 0.50 Market price per share (in S) 180 Current value of loan in ) 3,600,000 Average after-tax cost of debt 4.50% 3 4 5 9 10 2 3 5 Real estate The following are the details of the comparable companies: Comparable Companies Business operating segment Location Levered Beta Number of shares Issue price per share in $) Market price per share in S) Current value of loan in ) Cash and cash equivalent EBITDA Manufacturing NewLand 1.20 100,000,000 0.50 0.80 50,000,000 15,000,000 9,126,9841 Telecompil and gas upstream US NewLand 1.601 1.20 100,000,000 50,000,000 1.00 0.25 1.80 1.09 0.50 0.00 20,000,000 5,000,000 55,000,000 8,000,000 9,666,667 1,375,000 Oil and gas downstream NewLand 1.BD 30,000,000 0.25 1.20 9,600,000 Canada 1.50 15,000,000 1.00 1.50 2,500,000 12,500,000 822,360 10.000.000 2,069,767 Other information: Tax rate Risk free interest rate Market risk premium 25% 3.5% 5.8% 11 12 13 14 15 16 17 18 19 20 21 22 23 24 25 26 27 28 29 30 31 32 33 34 35 36 37 38 39 40 41 42 The extract of T-Oil's forecasted financial statements for an eight-year period of the downstream operation in New Land as follows (in $ 000) 20x1 Forecast 20x2 Forecast 20x3 Forecast 20x4 Forecast Sales 15,000 18,000 21,600 27,000 Direct cost 9.750 11.700 14.040 20,250 Depreciation 1,500 1,625 1,700 1,800 Other operating expenses 250 975 1360 350 Tax 300 3751 480 465 Capital expenditure 1,500 1.575 1,685 1,820 Changes to working capital 2001 -150 350 375 20X5 Forecast 33,750 25,313 2,000 638 590 1.984 -260 20X6 Forecast 42,188 31,641 2,150 797 645 2,182 400 20X7 Forecast 53,578 37,505 3000 1073 780 2.400 375 20X8 Forecast 68,044 47,631 3,200 2,213 860 2,689 -190 Free cash flows are expected to grow at 3 beyond 20x8 Required: 1. Calculate the WACC for the T-Oil downstream operation in Newland? 2. Calculate the value of the T-Oil downstream operation in New Land using Free Cash Flow method and EV/EBITDA multiple
Step by Step Solution
There are 3 Steps involved in it

Get step-by-step solutions from verified subject matter experts