

Question: A machine lls boxes with cereal. The labeled weight is 9 oz. The quality control department sampled three boxes every day for four days. The
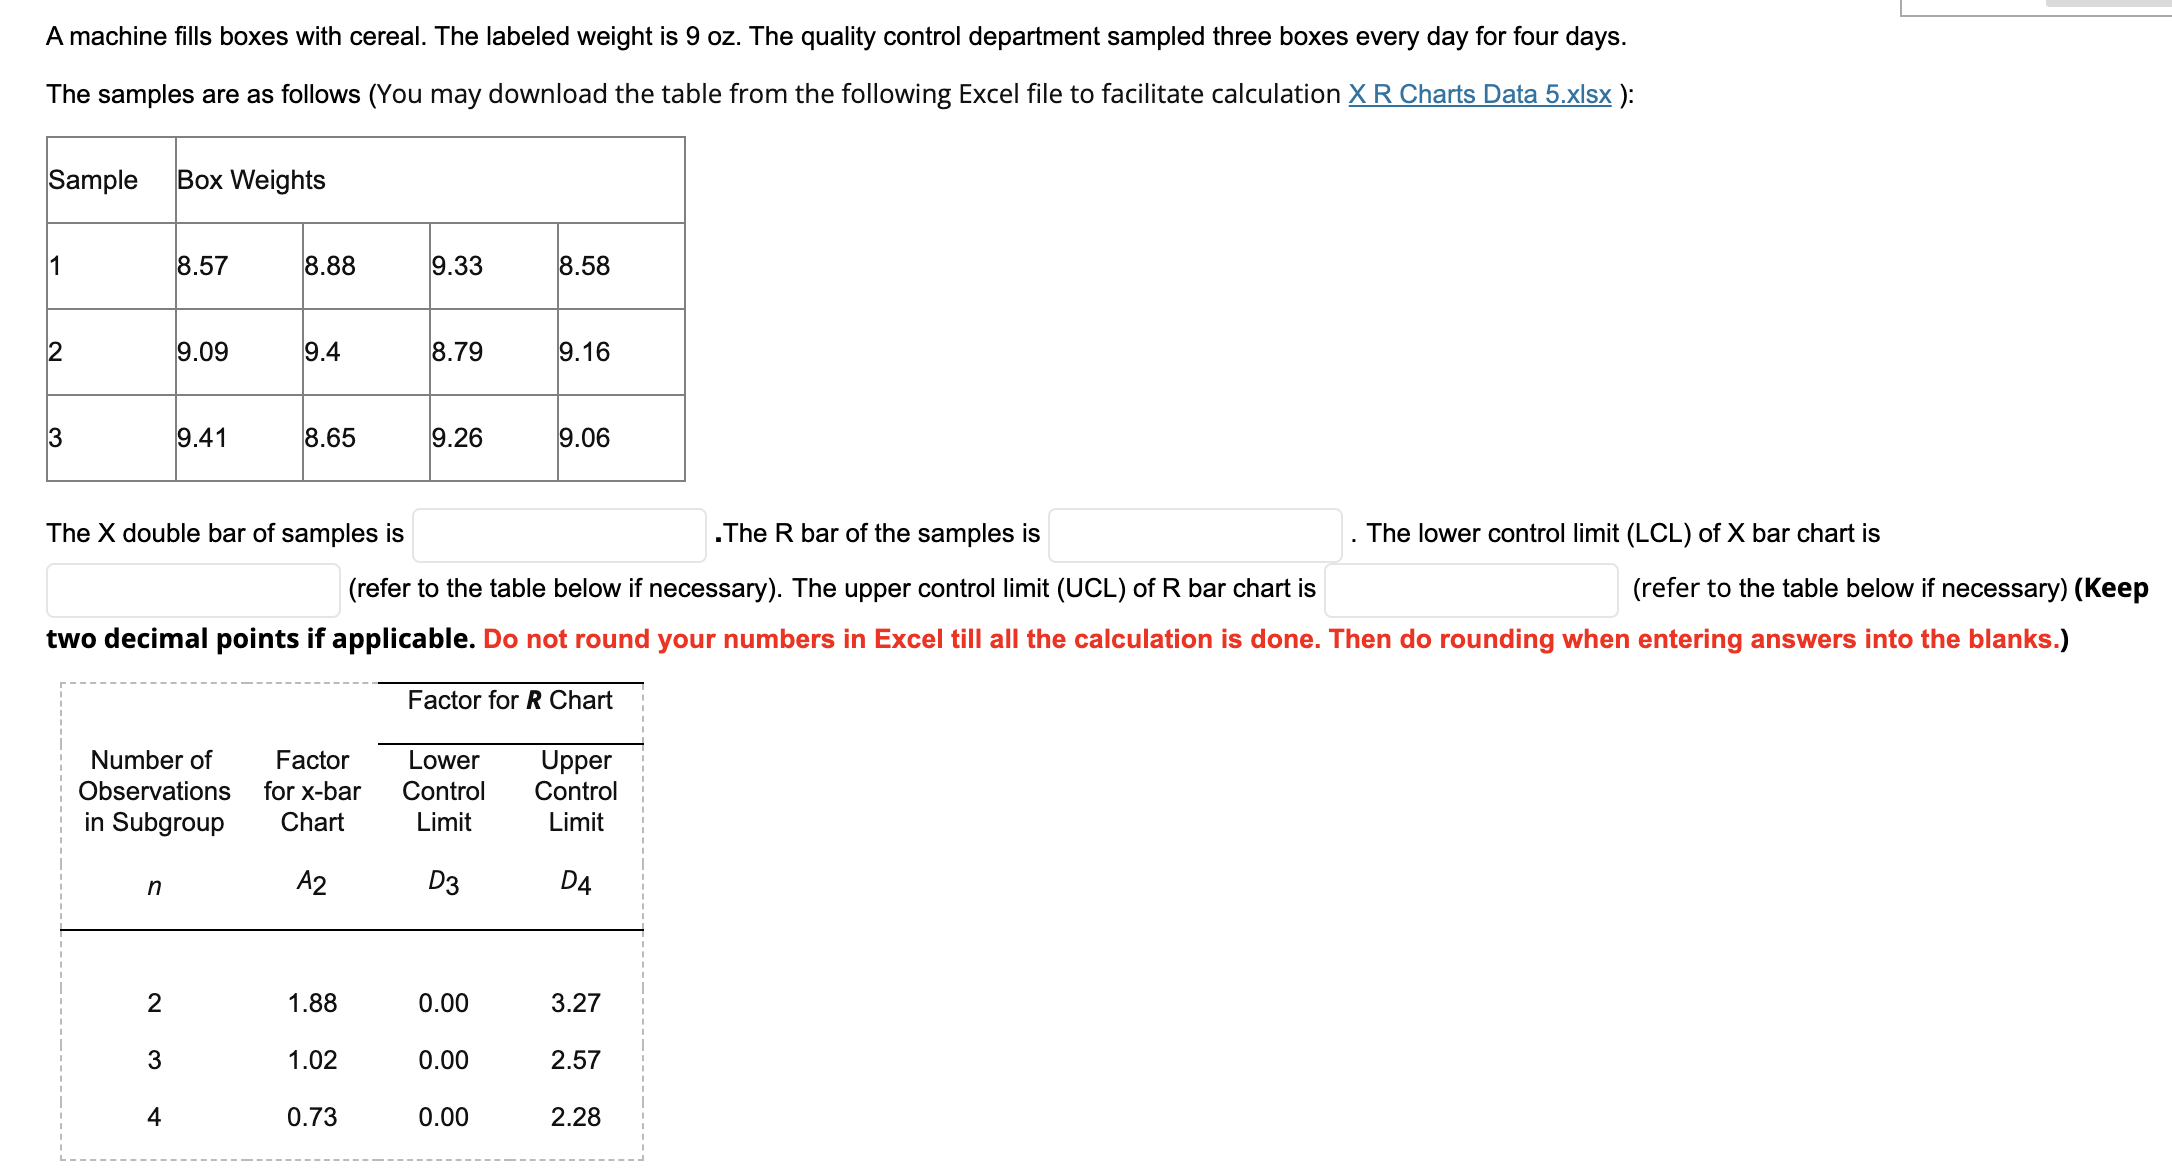
A machine lls boxes with cereal. The labeled weight is 9 oz. The quality control department sampled three boxes every day for four days. The samples are as fo lows (You may down oad the table from the following Excel le to facilitate calculation X R Charts Data 5.xlsx ): Sample Box Weights 1 8.57 8.88 9.33 8.58 2 9.09 9.4 8.79 9.16 3 9.41 8.65 9.26 9.06 The X double bar of samples is .The R bar of the samples is . The lower control limit (LCL) of X bar chart is (refer to the table below if necessary). The upper control limit (UCL) of R bar chart is (refer to the table below if necessary) (Keep two decimal points if applicable. Do not round your numbers in Excel till all the calculation is done. Then do rounding when entering answers into the blanks.) Factor for R Chart Number of Factor Lower Upper Observations for xbar Control Control in Subgroup Chart Limit Limit n A2 03 D4 2 1 .88 0.00 3.27 3 1 .02 0.00 2.57 4 0.73 0.00 2.28
Step by Step Solution
There are 3 Steps involved in it

Get step-by-step solutions from verified subject matter experts