

Question: A machining process is sampled. The 10 samples (each with 5 subgroup data points) are presented in the table below. All units are in inches.
 A machining process is sampled. The 10 samples (each with 5 subgroup data points) are presented in the table below. All units are in inches. Calculate the Upper and Lower Control Limits for both Range and X-Bar. Using a computerized graphing tool (MS Excel or other) generate Bar-X and R charts.
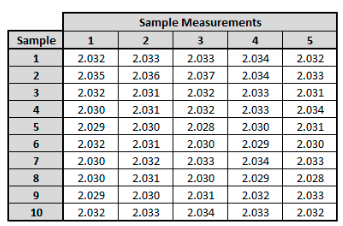
\begin{tabular}{|c|c|c|c|c|c|} \cline { 2 - 6 } \multicolumn{1}{c|}{} & \multicolumn{5}{c|}{ Sample Measurements } \\ \hline Sample & 1 & 2 & 3 & 4 & 5 \\ \hline 1 & 2.032 & 2.033 & 2.033 & 2.034 & 2.032 \\ \hline 2 & 2.035 & 2.036 & 2.037 & 2.034 & 2.033 \\ \hline 3 & 2.032 & 2.031 & 2.032 & 2.033 & 2.031 \\ \hline 4 & 2.030 & 2.031 & 2.032 & 2.033 & 2.034 \\ \hline 5 & 2.029 & 2.030 & 2.028 & 2.030 & 2.031 \\ \hline 6 & 2.032 & 2.031 & 2.030 & 2.029 & 2.030 \\ \hline 7 & 2.030 & 2.032 & 2.033 & 2.034 & 2.033 \\ \hline 8 & 2.030 & 2.031 & 2.030 & 2.029 & 2.028 \\ \hline 9 & 2.029 & 2.030 & 2.031 & 2.032 & 2.033 \\ \hline 10 & 2.032 & 2.033 & 2.034 & 2.033 & 2.032 \\ \hline \end{tabular}
Step by Step Solution
There are 3 Steps involved in it

Get step-by-step solutions from verified subject matter experts