

Question: A mail-attachment.googleusercontent.com Question 4: Examining sample variability using samples of n = 350 Part 1: Record the characteristics of the Sampling Distribution of Samples of

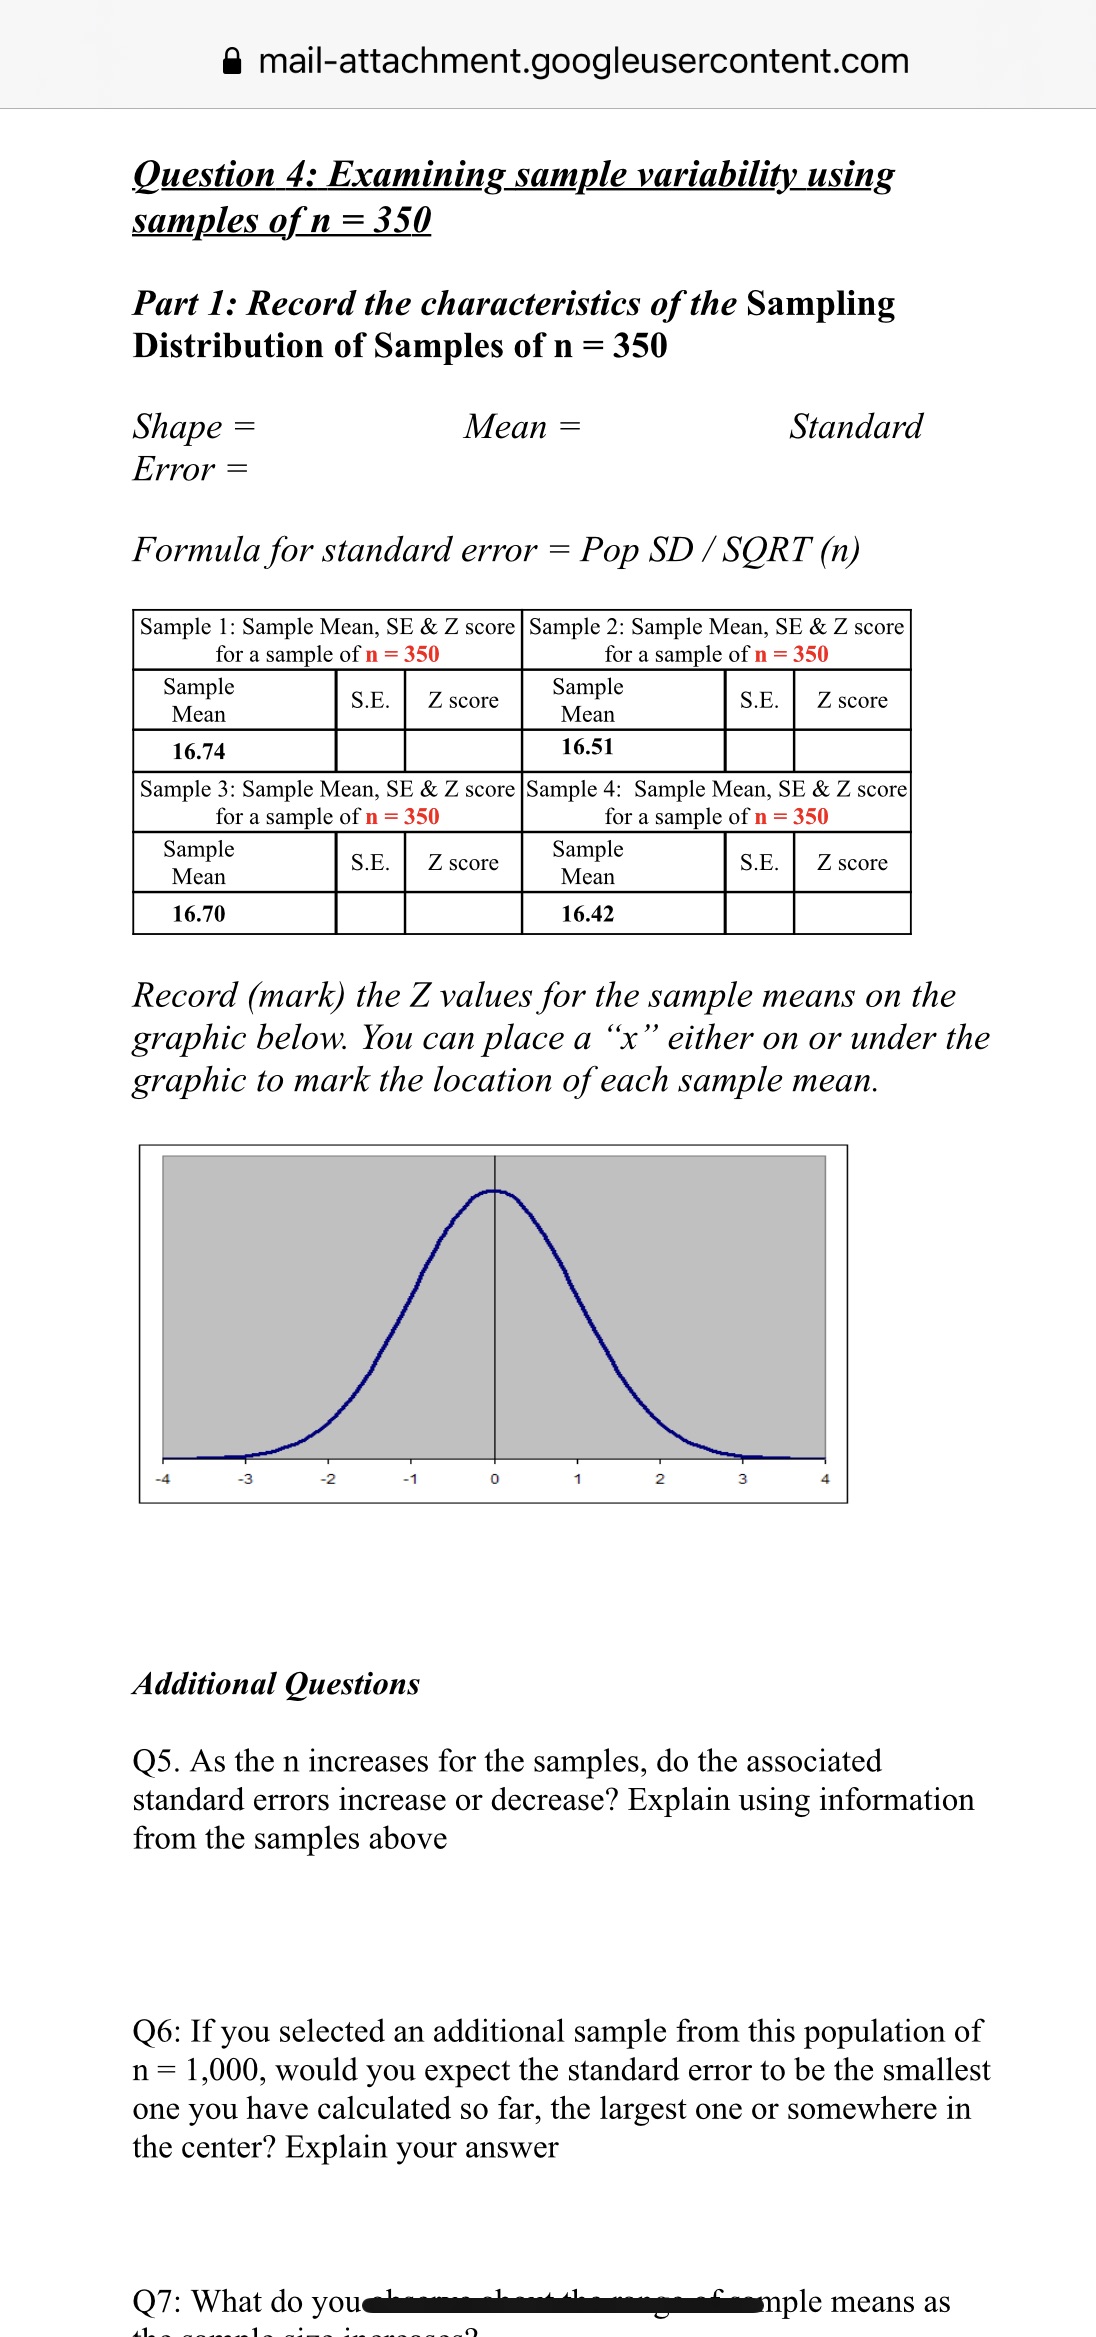
A mail-attachment.googleusercontent.com Question 4: Examining sample variability using samples of n = 350 Part 1: Record the characteristics of the Sampling Distribution of Samples of n = 350 Shape = Mean = Standard Error = Formula for standard error = Pop SD / SORT (n) Sample 1: Sample Mean, SE & Z score Sample 2: Sample Mean, SE & Z score for a sample of n = 350 for a sample of n = 350 Sample S.E. Mean Z score Sample S.E. Mean Z score 16.74 16.51 Sample 3: Sample Mean, SE & Z score Sample 4: Sample Mean, SE & Z score for a sample of n = 350 for a sample of n = 350 Sample S.E. Z score Sample Mean Mean S.E Z score 16.70 16.42 Record (mark) the Z values for the sample means on the graphic below. You can place a "x" either on or under the graphic to mark the location of each sample mean. -3 -2 -1 2 3 Additional Questions Q5. As the n increases for the samples, do the associated standard errors increase or decrease? Explain using information from the samples above Q6: If you selected an additional sample from this population of n = 1,000, would you expect the standard error to be the smallest one you have calculated so far, the largest one or somewhere in the center? Explain your answer Q7: What do you mple means as
Step by Step Solution
There are 3 Steps involved in it

Get step-by-step solutions from verified subject matter experts