

Question: (a) Make a scatter plot for the data presented in the table. x -2 -2 -1 0 1 1 1 2 2 3 y 2
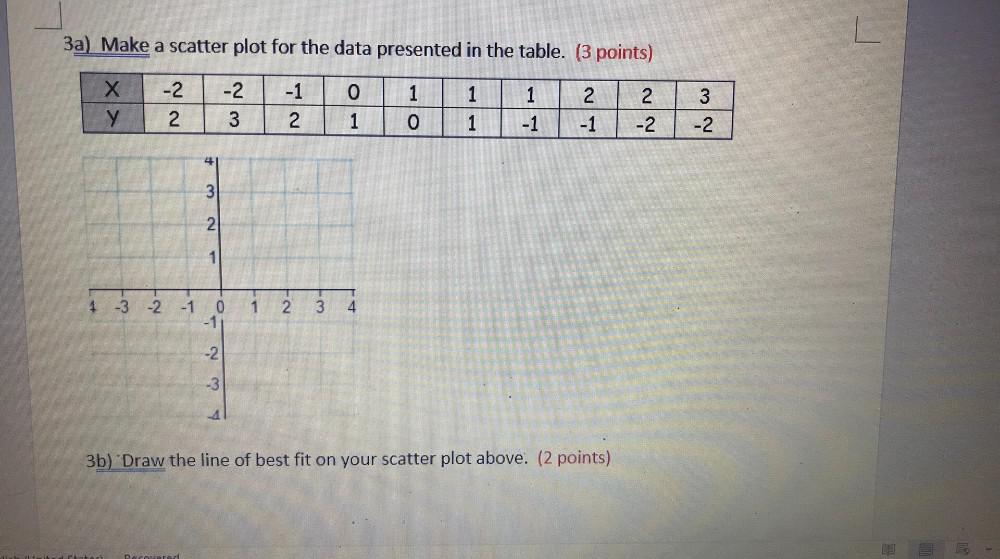

(a) Make a scatter plot for the data presented in the table. x -2 -2 -1 0 1 1 1 2 2 3 y 2 3 2 1 0 1 -1 -1 -2 -2(b) Draw the line of best fit on your scatter plot above.
Step by Step Solution
There are 3 Steps involved in it
1 Expert Approved Answer
Step: 1 Unlock

Question Has Been Solved by an Expert!
Get step-by-step solutions from verified subject matter experts
Step: 2 Unlock
Step: 3 Unlock