

Question: a) make a scatterplot of the table above on your graphing calculator. b) find the linear regression equation in the form y = mx +
a) make a scatterplot of the table above on your graphing calculator. b) find the linear regression equation in the form y = mx + b. What is r, the correction coefficient?c) graph the linear regression equationd) find the best predicted weight of a supermodel who is 72 in. tall
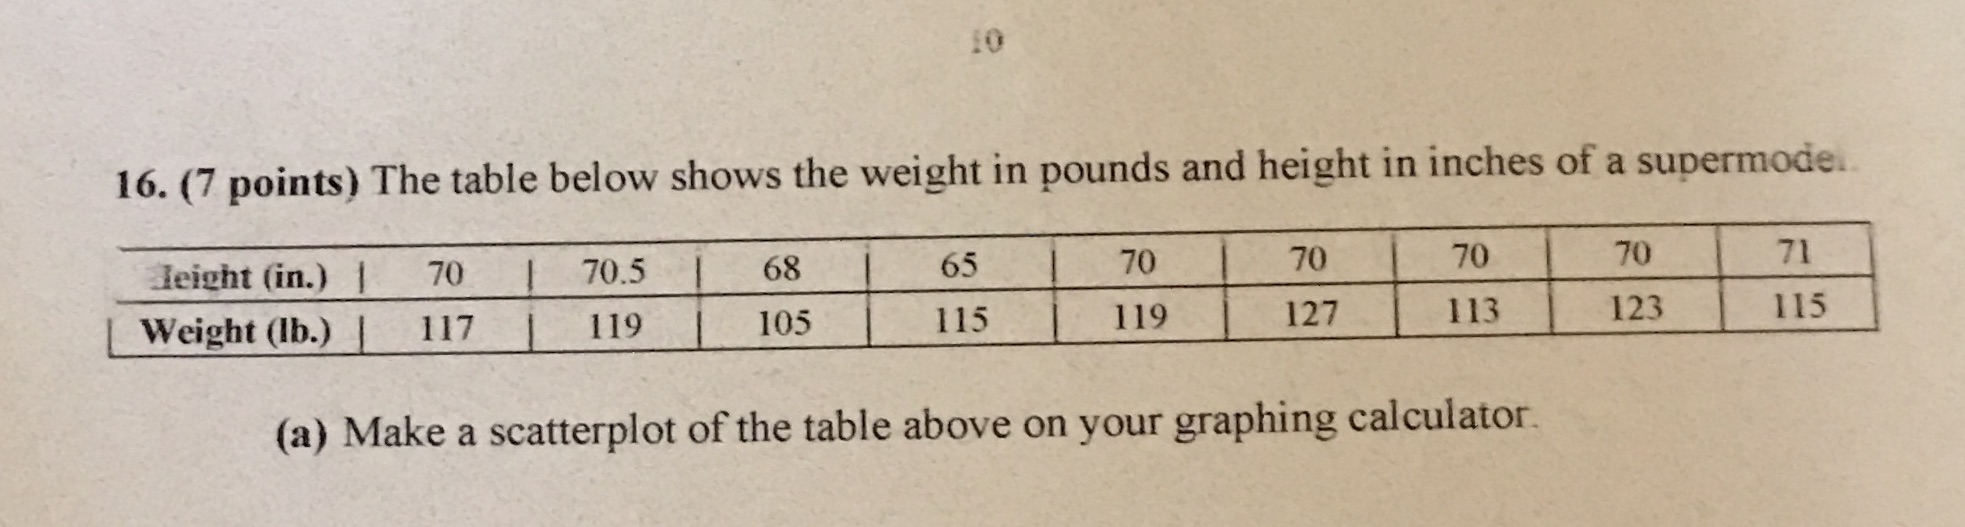
16. (7 points) The table below shows the weight in pounds and height in inches of a supermode. Height (in.) | 70 70.5 68 65 70 70 70 70 71 Weight (Ib.) | 117 | 119 105 115 119 127 113 123 115 (a) Make a scatterplot of the table above on your graphing calculator
Step by Step Solution
There are 3 Steps involved in it
1 Expert Approved Answer
Step: 1 Unlock

Question Has Been Solved by an Expert!
Get step-by-step solutions from verified subject matter experts
Step: 2 Unlock
Step: 3 Unlock