

Question: (a) Make a scatterplot that shows how national wine consumption helps explain heart disease death rates (b) Describe in words the direction , form ,
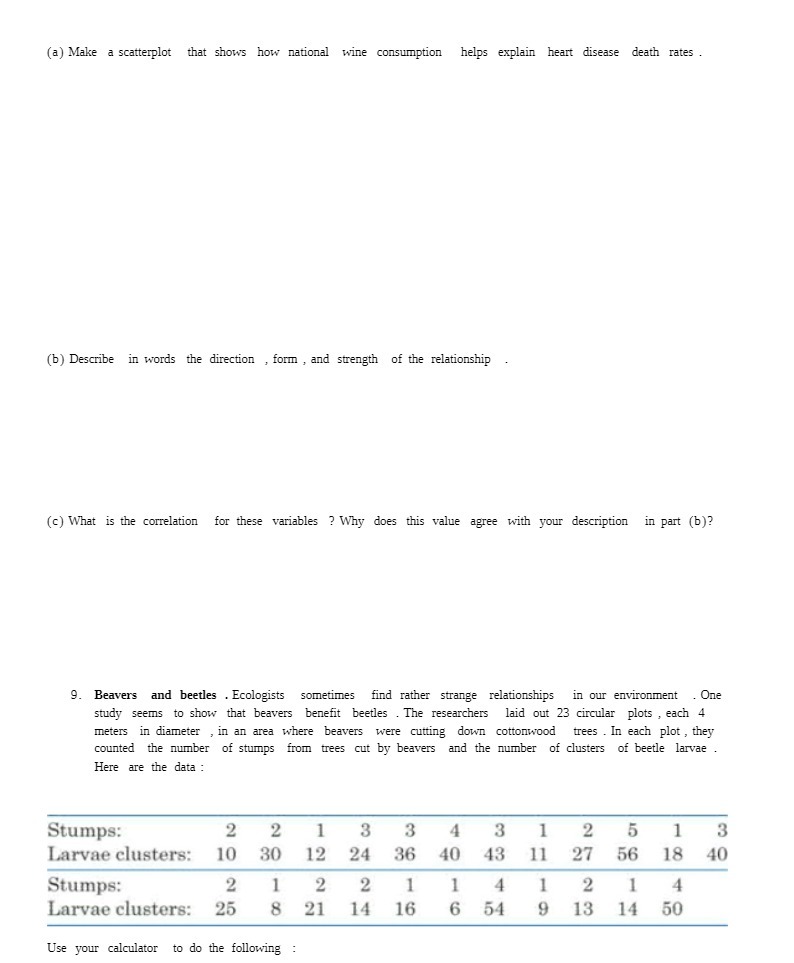
(a) Make a scatterplot that shows how national wine consumption helps explain heart disease death rates (b) Describe in words the direction , form , and strength of the relationship (c) What is the correlation for these variables ? Why does this value agree with your description in part (b)? 9. Beavers and beetles . Ecologists sometimes find rather strange relationships in our environment . One study seems to show that beavers benefit beetles . The researchers laid out 23 circular plots , each 4 meters in diameter , in an area where beavers were cutting down cottonwood trees . In each plot , they counted the number of stumps from trees cut by beavers and the number of clusters of beetle larvae Here are the data : Stumps: 2 2 1 3 3 4 3 1 2 5 1 3 Larvae clusters: 10 30 12 24 36 40 43 11 27 56 18 40 Stumps: 2 1 2 2 1 4 1 2 1 Larvae clusters: 25 8 21 14 16 6 54 9 13 14 50 Use your calculator to do the following
Step by Step Solution
There are 3 Steps involved in it

Get step-by-step solutions from verified subject matter experts