

Question: A manager wishes to build a 3 -sigma range chart for a process. The sample size is five, the mean of sample means is 36.00
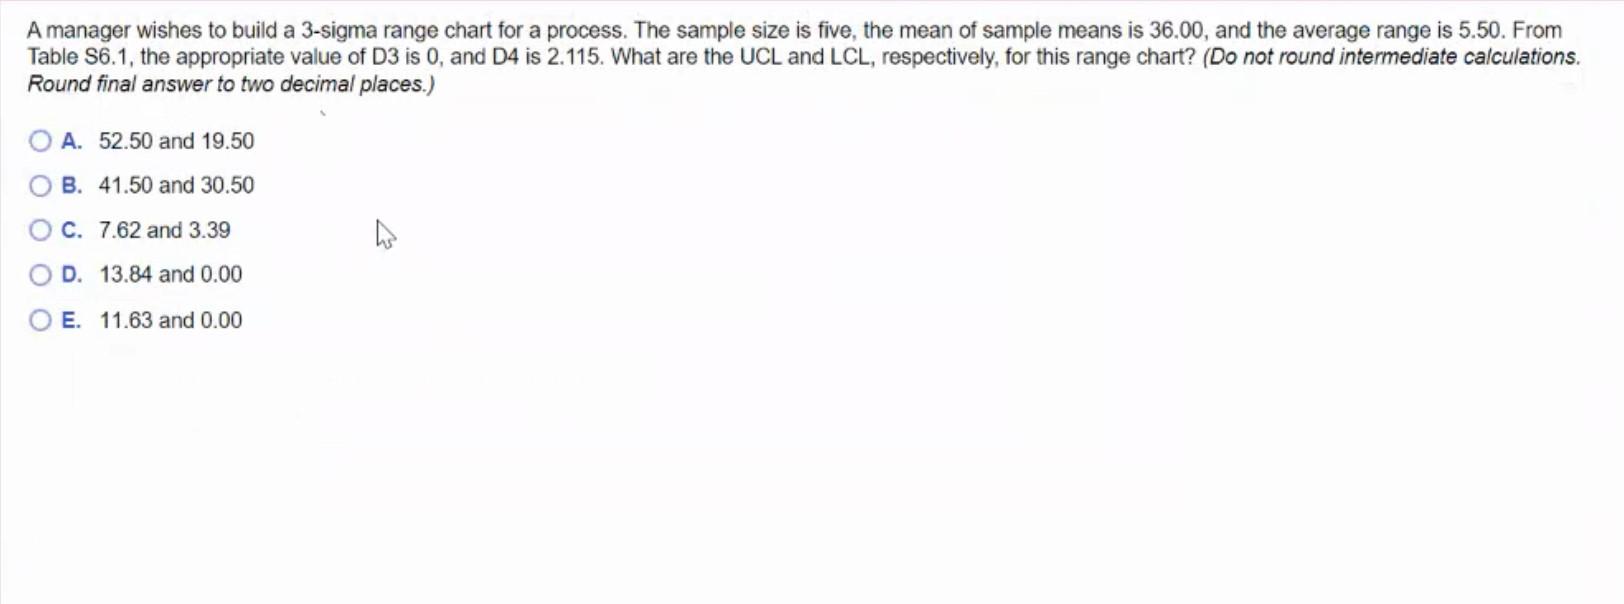
A manager wishes to build a 3 -sigma range chart for a process. The sample size is five, the mean of sample means is 36.00 , and the average range is 5.50 . From Table S6.1, the appropriate value of D3 is 0 , and D4 is 2.115 . What are the UCL and LCL, respectively, for this range chart? (Do not round intermediate calculations. Round final answer to two decimal places.) A. 52.50 and 19.50 B. 41.50 and 30.50 C. 7.62 and 3.39 D. 13.84 and 0.00 E. 11.63 and 0.00
Step by Step Solution
There are 3 Steps involved in it
1 Expert Approved Answer
Step: 1 Unlock

Question Has Been Solved by an Expert!
Get step-by-step solutions from verified subject matter experts
Step: 2 Unlock
Step: 3 Unlock