

Question: Q50 and 51 Considering our discussions on Statistical Process Control, SPC, according to the text, what is the most common choice of limits for control
Q50
and 51
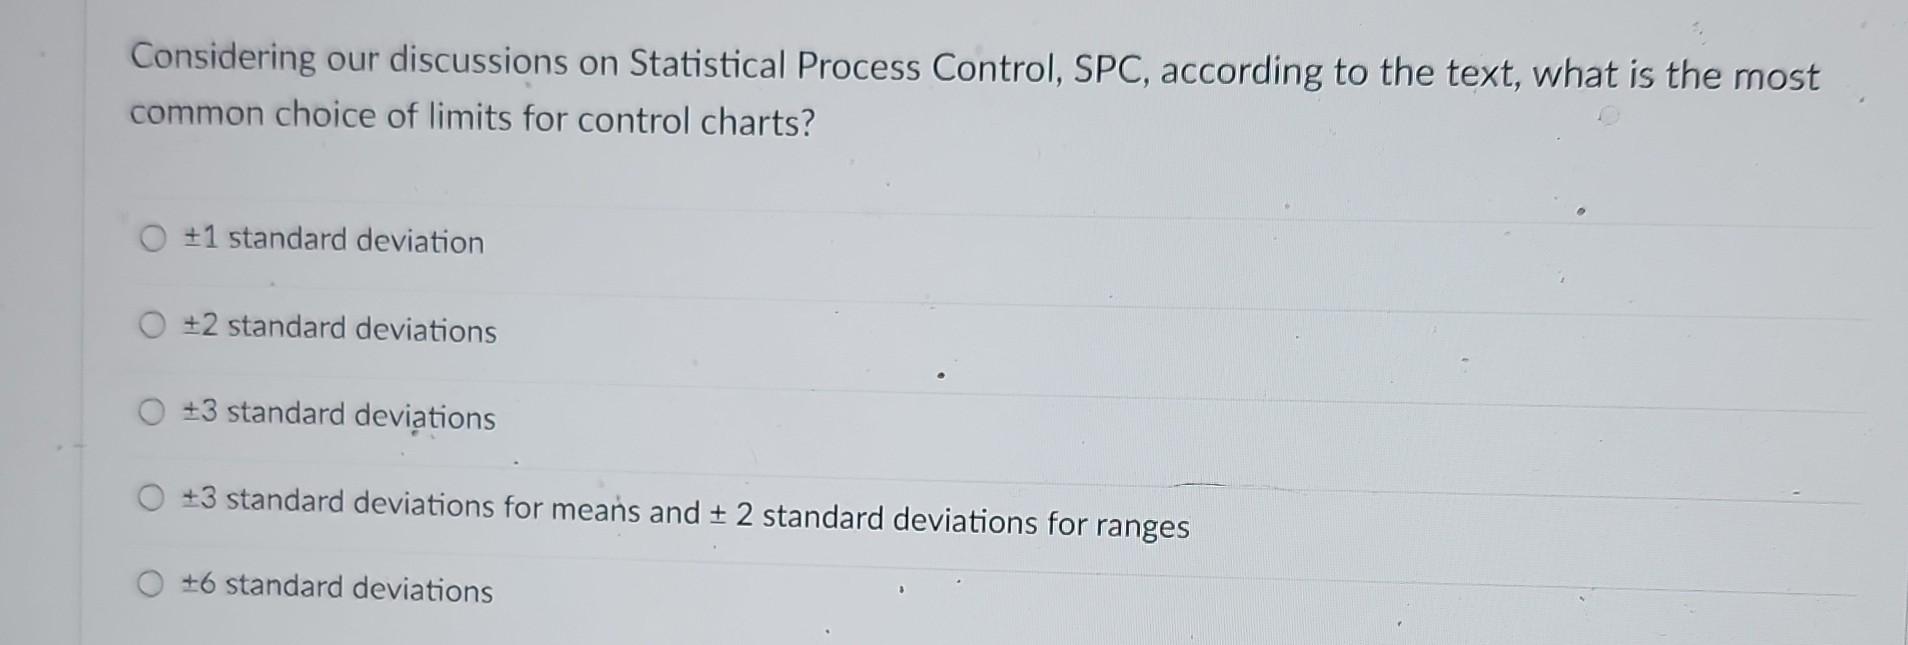
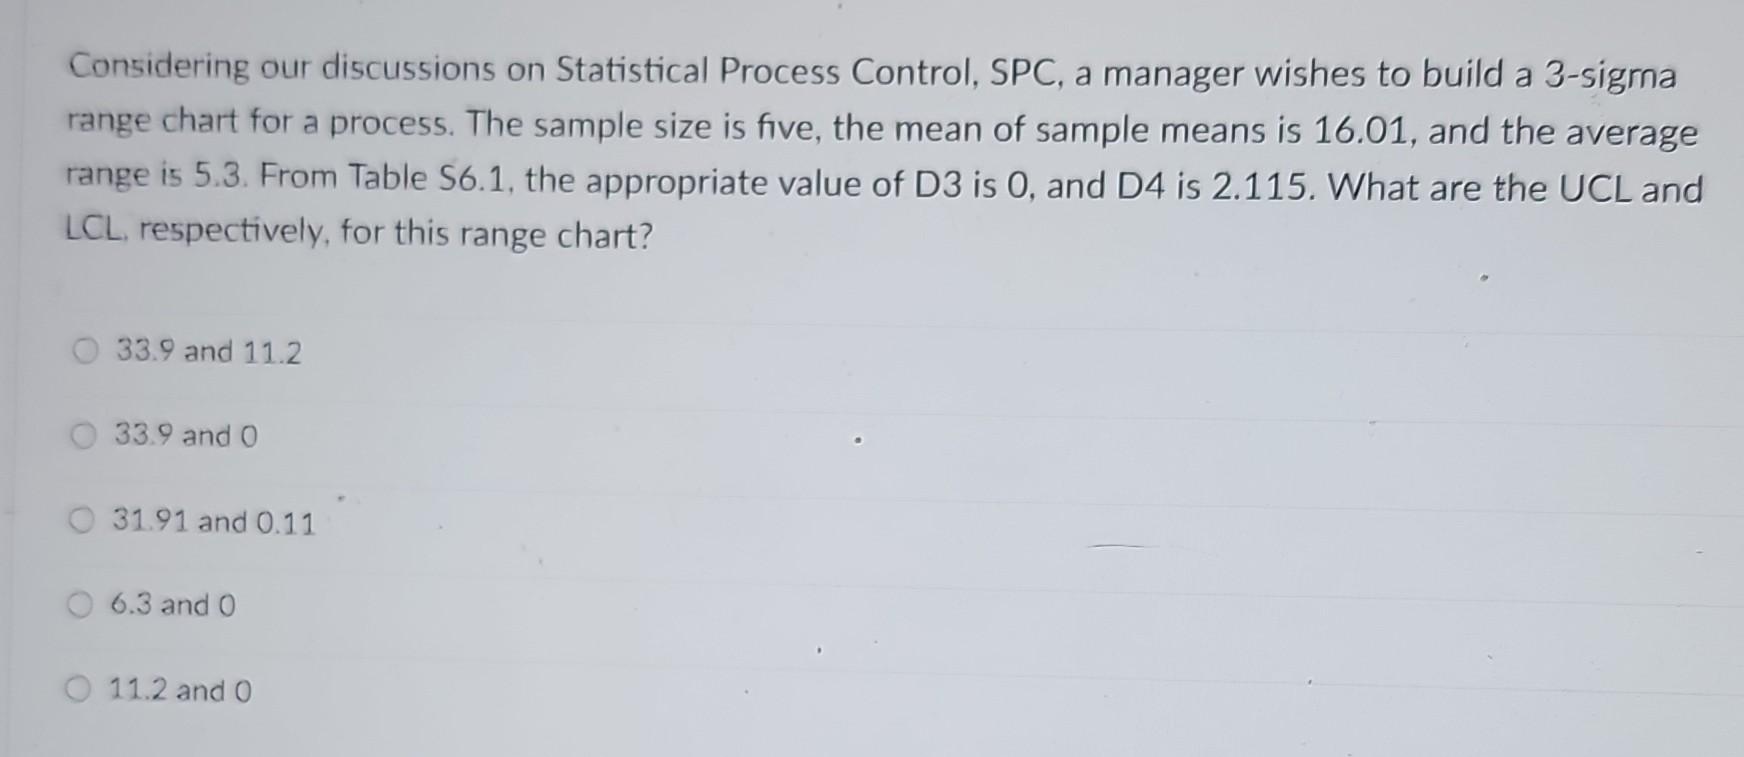
Considering our discussions on Statistical Process Control, SPC, according to the text, what is the most common choice of limits for control charts? \pm 1 standard deviation \pm 2 standard deviations \pm 3 standard deviations \pm 3 standard deviations for means and \pm 2 standard deviations for ranges \pm 6 standard deviations Considering our discussions on Statistical Process Control, SPC, a manager wishes to build a 3 -sigrna range chart for a process. The sample size is five, the mean of sample means is 16.01 , and the average range is 5.3. From Table S6.1, the appropriate value of D3 is 0 , and D4 is 2.115 . What are the UCL and LCL, respectively, for this range chart? 33.9 and 11.2 33.9 and 0 31.91 and 0.11 6.3 and 0 11.2 and 0
Step by Step Solution
There are 3 Steps involved in it

Get step-by-step solutions from verified subject matter experts