

Question: A methane analysis was performed by Light Yagami. His least squares analysis returned the following data: Equation of calibration curve: Signal in mV=870[ppm concentration of
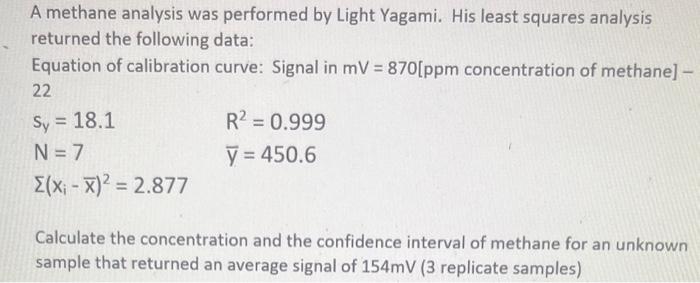
A methane analysis was performed by Light Yagami. His least squares analysis returned the following data: Equation of calibration curve: Signal in mV=870[ppm concentration of methane] 22 sy=18.1N=7(xix)2=2.877R2=0.999y=450.6 Calculate the concentration and the confidence interval of methane for an unknown sample that returned an average signal of 154mV ( 3 replicate samples)
Step by Step Solution
There are 3 Steps involved in it
1 Expert Approved Answer
Step: 1 Unlock

Question Has Been Solved by an Expert!
Get step-by-step solutions from verified subject matter experts
Step: 2 Unlock
Step: 3 Unlock