

Question: A Moving to another question will save this response. Question 24 5 points Save Answe Studies on a bottle-filling machine indicate that it fills bottles
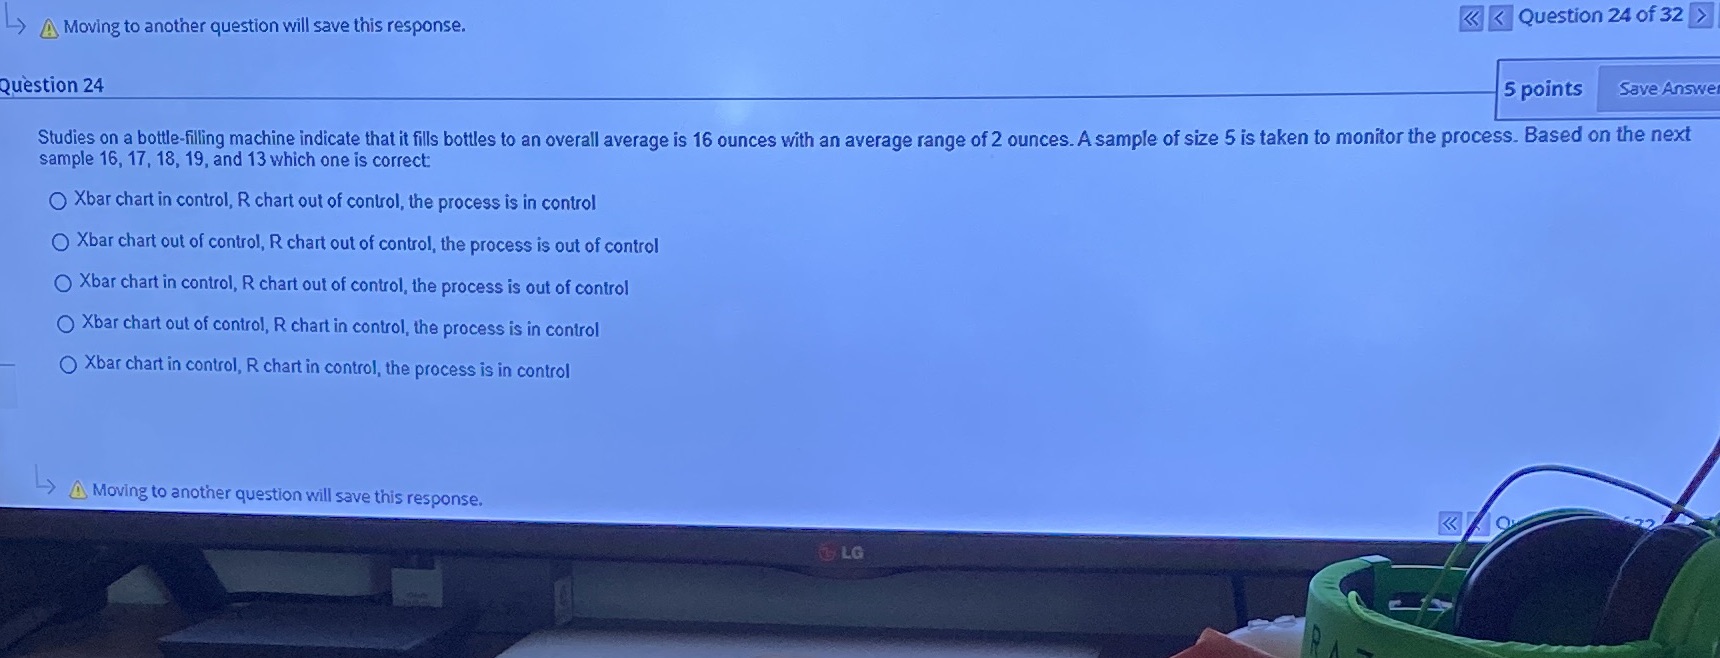
A Moving to another question will save this response. Question 24 5 points Save Answe Studies on a bottle-filling machine indicate that it fills bottles to an overall average is 16 ounces with an average range of 2 ounces. A sample of size 5 is taken to monitor the process. Based on the next sample 16, 17, 18, 19, and 13 which one is correct: O Xbar chart in control, R chart out of control, the process is in control O Xbar chart out of control, R chart out of control, the process is out of control O Xbar chart in control, R chart out of control, the process is out of control O Xbar chart out of control, R chart in control, the process is in control O Xbar chart in control, R chart in control, the process is in control Moving to another question will save this response. LG
Step by Step Solution
There are 3 Steps involved in it

Get step-by-step solutions from verified subject matter experts