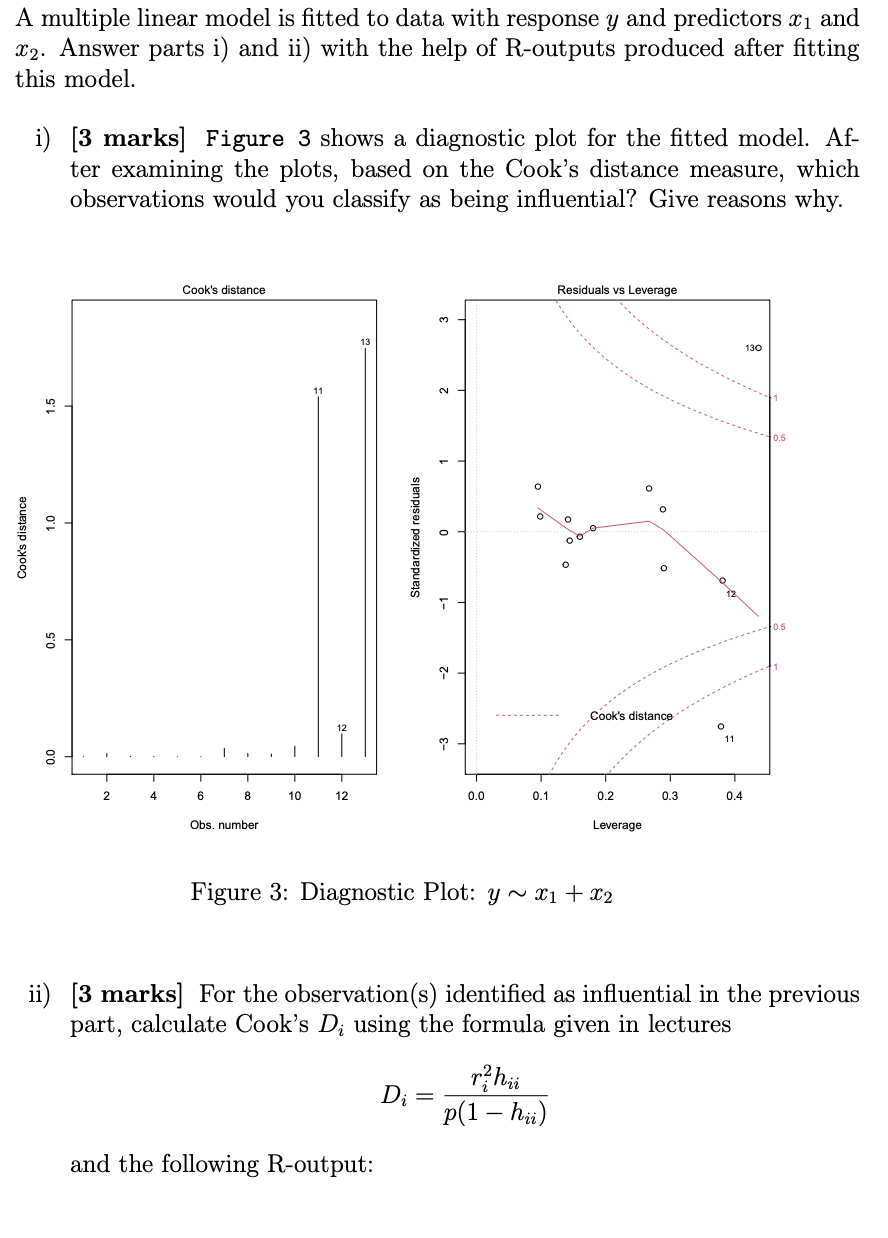
Question: A multiple linear model is fitted to data with response y and predictors 21 and 22. Answer parts i) and ii) with the help of

A multiple linear model is fitted to data withA multiple linear model is fitted to data with

A multiple linear model is fitted to data with response y and predictors 21 and 22. Answer parts i) and ii) with the help of R-outputs produced after fitting this model. i) [3 marks] Figure 3 shows a diagnostic plot for the fitted model. Af- ter examining the plots, based on the Cook's distance measure, which observations would you classify as being influential? Give reasons why. Cook's distance Residuals vs Leverage 13 130 1.0 Cook's distance Standardized residuals O T 0.5 Cook's distance 11 1 1 0.0 T 1 T 6 1 0.4 2 4 8 10 12 0.0 0.1 0.2 0.3 Obs. number Leverage Figure 3: Diagnostic Plot: y~ x1 + x2 ii) [3 marks] For the observation(s) identified as influential in the previous part, calculate Cook's Di using the formula given in lectures Di r? hii p(1 hii) and the following R-output: > model hatvalues (model) 1 2 3 4 5 6 0.14423641 0.28862704 0.14164879 0.09863649 0.18048629 0.15995646 7 8 9 10 11 12 0.29003420 0.09505224 0.13806694 0.26717202 0.37847203 0.38099986 13 0.43661124 > rstandard (model) 1 2 3 4 5 6 -0.12543602 0.31684273 0.17350829 0.21594335 0.05115624 -0.06995024 7 8 9 10 11 12 -0.51572178 0.63864291 -0.46679194 0.61214275 -2.75414799 -0.69093819 13 2.60073093 Consider now the full rank general linear model y = XB+ (with usual assumptions discussed in lectures: y is an n x1 vector of responses, X is an n xp design matrix and is a vector of zero mean errors uncorrelated with variance 02) and answer parts iii) and iv). A multiple linear model is fitted to data with response y and predictors 21 and 22. Answer parts i) and ii) with the help of R-outputs produced after fitting this model. i) [3 marks] Figure 3 shows a diagnostic plot for the fitted model. Af- ter examining the plots, based on the Cook's distance measure, which observations would you classify as being influential? Give reasons why. Cook's distance Residuals vs Leverage 13 130 1.0 Cook's distance Standardized residuals O T 0.5 Cook's distance 11 1 1 0.0 T 1 T 6 1 0.4 2 4 8 10 12 0.0 0.1 0.2 0.3 Obs. number Leverage Figure 3: Diagnostic Plot: y~ x1 + x2 ii) [3 marks] For the observation(s) identified as influential in the previous part, calculate Cook's Di using the formula given in lectures Di r? hii p(1 hii) and the following R-output: > model hatvalues (model) 1 2 3 4 5 6 0.14423641 0.28862704 0.14164879 0.09863649 0.18048629 0.15995646 7 8 9 10 11 12 0.29003420 0.09505224 0.13806694 0.26717202 0.37847203 0.38099986 13 0.43661124 > rstandard (model) 1 2 3 4 5 6 -0.12543602 0.31684273 0.17350829 0.21594335 0.05115624 -0.06995024 7 8 9 10 11 12 -0.51572178 0.63864291 -0.46679194 0.61214275 -2.75414799 -0.69093819 13 2.60073093 Consider now the full rank general linear model y = XB+ (with usual assumptions discussed in lectures: y is an n x1 vector of responses, X is an n xp design matrix and is a vector of zero mean errors uncorrelated with variance 02) and answer parts iii) and iv)

Step by Step Solution

There are 3 Steps involved in it

1 Expert Approved Answer
Step: 1 Unlock blur-text-image
Question Has Been Solved by an Expert!

Get step-by-step solutions from verified subject matter experts

Step: 2 Unlock
Step: 3 Unlock

Students Have Also Explored These Related General Management Questions!