

Question: A multiple linear regression analysis was carried out using data for 60 residential housing sales in a given area in the east coast of the
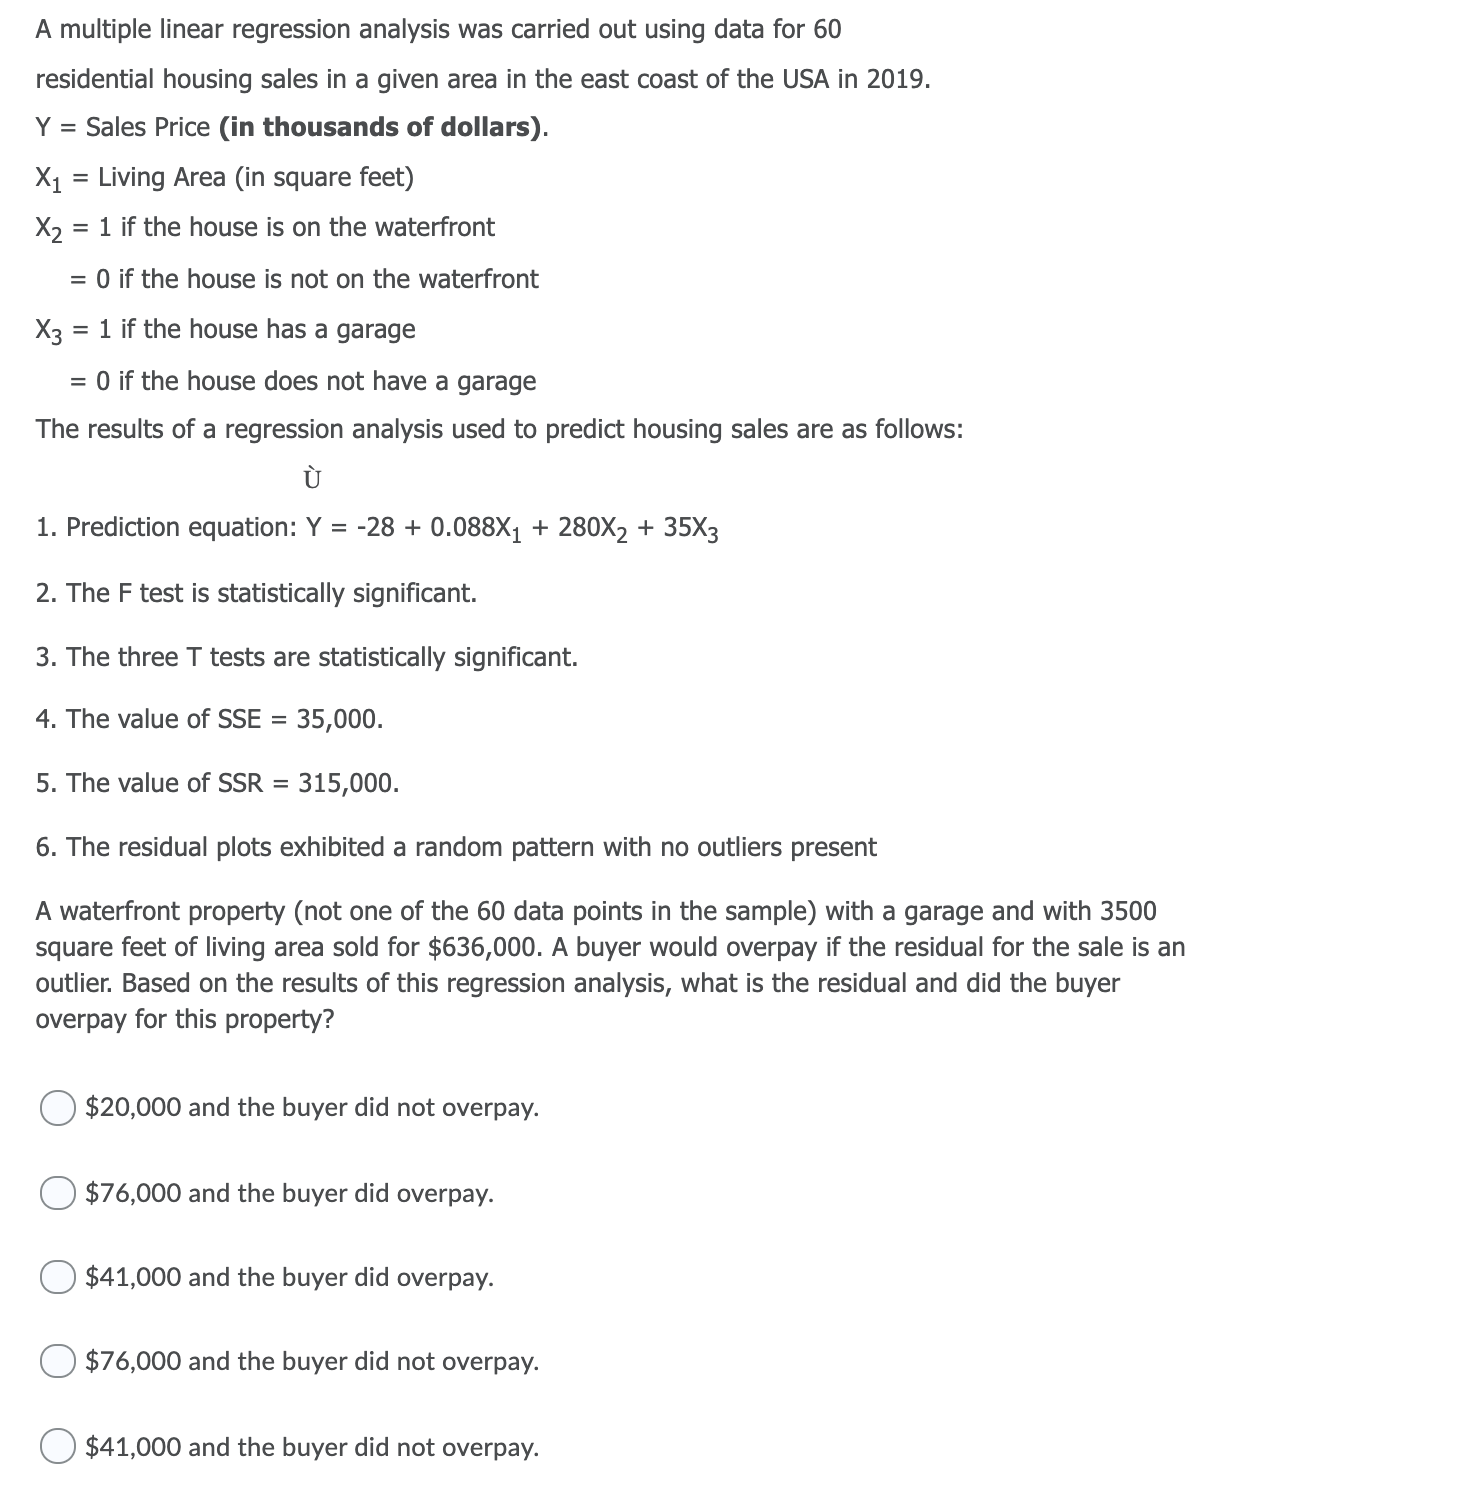
A multiple linear regression analysis was carried out using data for 60 residential housing sales in a given area in the east coast of the USA in 2019. Y = Sales Price (in thousands of dollars). X1 = Living Area (in square feet) X2 = 1 if the house is on the waterfront = 0 if the house is not on the waterfront X3 = 1 if the house has a garage = 0 if the house does not have a garage The results of a regression analysis used to predict housing sales are as follows: U 1. Prediction equation: Y = -28 + 0.088X1 + 280X2 + 35x3 2. The F test is statistically signicant. 3. The three T tests are statistically signicant. 4. The value of SSE = 35,000. 5. The value of SSR = 315,000. 6. The residual plots exhibited a random pattern with no outliers present A waterfront property (not one of the 60 data points in the sample) with a garage and with 3500 square feet of living area sold for $636,000. A buyer would overpay if the residual for the sale is an outlier: Based on the results of this regression analysis, what is the residual and did the buyer Overpay for this property? 0 $20,000 and the buyer did not overpay. 0 $76,000 and the buyer did overpay. 0 $41,000 and the buyer did overpay. 0 $76,000 and the buyer did not overpay. 0 $41,000 and the buyer did not overpay
Step by Step Solution
There are 3 Steps involved in it

Get step-by-step solutions from verified subject matter experts