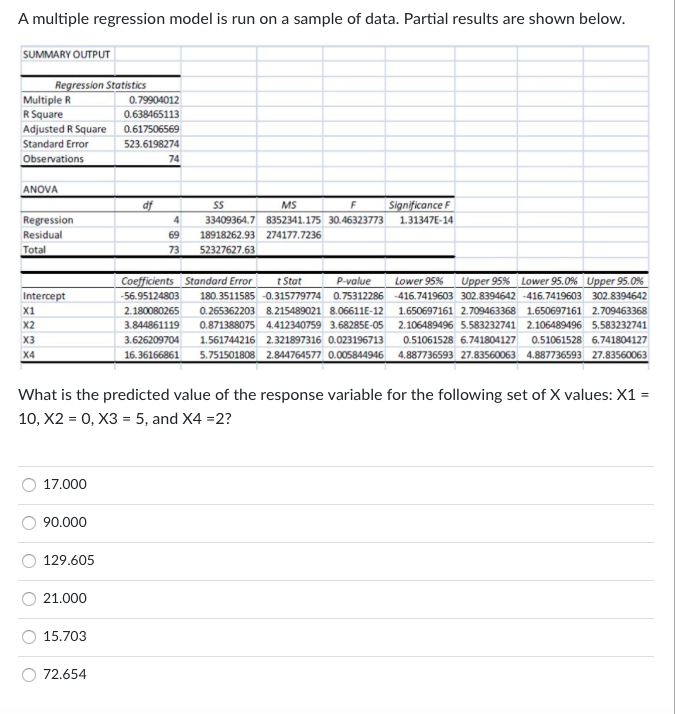
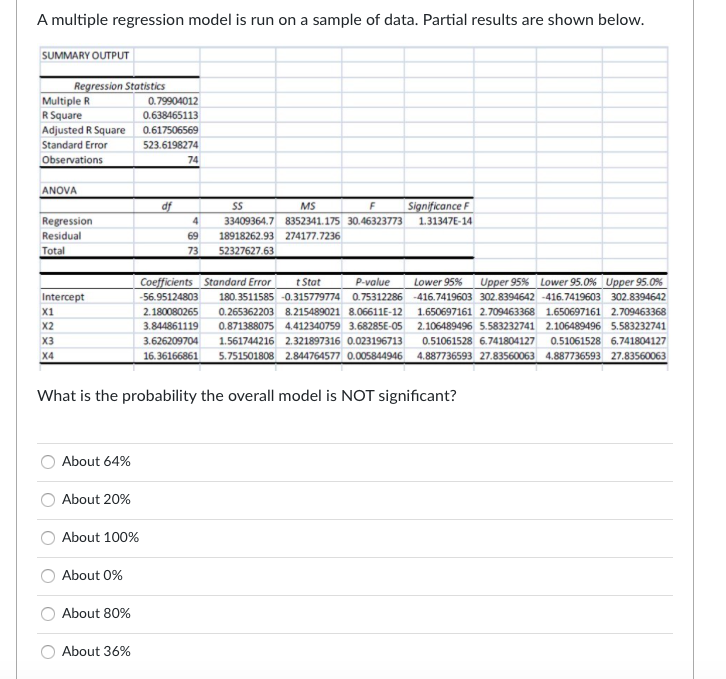
Question: A multiple regression model is run on a sample of data. Partial results are shown below. SUMMARY OUTPUT Regression Statistics 0.79904012 0.638465113 Multiple R R

A multiple regression model is run on a sample ofA multiple regression model is run on a sample ofA multiple regression model is run on a sample ofA multiple regression model is run on a sample ofA multiple regression model is run on a sample ofA multiple regression model is run on a sample of

A multiple regression model is run on a sample of data. Partial results are shown below. SUMMARY OUTPUT Regression Statistics 0.79904012 0.638465113 Multiple R R Square Adjusted R Square Standard Error Observations 0.617506569 523.6198274 74 ANOVA df SS MS F Significance F 4 33409364.7 8352341.175 30.46323773 1.31347E-14 Regression Residual Total 69 18918262.93 274177.7236 73 52327627.63 Coefficients Standard Error t Stat P-value Lower 95% Upper 95% Lower 95.0% Upper 95.0% -56.95124803 180.3511585 -0.315779774 0.75312286 416.7419603 302.8394642 -416.7419603 302.8394642 Intercept X1 2.180080265 0.265362203 8.215489021 8.06611E-12 1.650697161 2.709463368 1.650697161 2.709463368 X2 3.844861119 0.871388075 4.412340759 3.68285E-05 2.106489496 5.583232741 2.106489496 5.583232741 X3 3.626209704 1.561744216 2.321897316 0.023196713 0.51061528 6.741804127 0.51061528 6.741804127 X4 16.36166861 5.751501808 2.844764577 0.005844946 4.887736593 27.835600634.887736593 27.83560063 What is the predicted value of the response variable for the following set of X values: X1 = 10, X2 = 0, X3 = 5, and X4 = 2? 17.000 90.000 129.605 21.000 15.703 72.654 A multiple regression model is run on a sample of data. Partial results are shown below. SUMMARY OUTPUT Regression Statistics Multiple R 0.79904012 R Square 0.638465113 Adjusted R Square 0.617506569 Standard Error 523.6198274 Observations 74 ANOVA df SS MS Significance F 4 33409364.7 8352341.175 30.46323773 1.31347E-14 Regression Residual Total 69 18918262.93 274177.7236 73 52327627.63 Intercept X1 Coefficients Standard Error t Stat P-value Lower 95% Upper 95% Lower 95.0% Upper 95.0% -56.95124803 180.3511585 -0.315779774 0.75312286 -416.7419603 302.8394642 - 416.7419603302.8394642 2.180080265 0.265362203 8.215489021 8.06611E-12 1.650697161 2.709463368 1.650697161 2.709463368 3.844861119 0.871388075 4.412340759 3.68285E-05 2.106489496 5.583232741 2.106489496 5.583232741 3.626209704 1.561744216 2.321897316 0.023196713 0.51061528 6.741804127 0.51061528 6.741804127 16.36166861 5.751501808 2.844764577 0.005844946 4.887736593 27.83560063 4.887736593 27.83560063 X2 X3 X4 Is variable X4 a statistically significant predictor? Yes, the significance level is greater than 5%. No, the significance level is smaller than 5%. Yes, the significance level is smaller than 5%. Cannot be determined. No, the significance level is greater than 5%. A multiple regression model is run on a sample of data. Partial results are shown below. SUMMARY OUTPUT Regression Statistics 0.79904012 0.638465113 Multiple R R Square Adjusted R Square Standard Error 0.617506569 523.6198274 Observations 74 ANOVA df SS MS Significance F 1.31347E-14 4 33409364.7 8352341.175 30.46323773 Regression Residual Total 69 18918262.93 274177.7236 73 52327627.63 Coefficients Standard Error -56.95124803 Intercept X1 t Stat P-value Lower 95% Upper 95% Lower 95.0% Upper 95.0% 180.3511585 -0.315779774 0.75312286 416.7419603 302.8394642 -416.7419603 302.8394642 0.265362203 8.215489021 8.06611E-12 1.650697161 2.709463368 1.650697161 2.709463368 0.871388075 4.412340759 3.68285E-05 2.106489496 5.583232741 2.106489496 5.583232741 2.180080265 X2 3.844861119 X3 3.626209704 1.561744216 2.321897316 0.023196713 0.51061528 6.741804127 0.51061528 6.741804127 X4 16.36166861 5.751501808 2.844764577 0.0058449464.887736593 27.83560063 4.887736593 27.83560063 How many independent variables are statistically significant predictors? N O 4 O 1 O 0 3 3 A multiple regression model is run on a sample of data. Partial results are shown below. SUMMARY OUTPUT Regression Statistics Multiple R 0.79904012 R Square 0.638465113 Adjusted R Square 0.617506569 Standard Error 523.6198274 Observations 74 ANOVA df SS MS F Significance F 1.31347E-14 Regression 4 33409364.7 8352341.175 30.46323773 Residual 69 18918262.93 274177.7236 Total 73 52327627.63 Intercept X1 Coefficients Standard Error t Stat P-value Lower 95% Upper 95% Lower 95.0% Upper 95.0% -56.95124803 180.3511585 -0.315779774 0.75312286 416.7419603 302.8394642 -416.7419603 302.8394642 2.180080265 0.265362203 8.215489021 8.06611E-12 1.650697161 2.709463368 1.650697161 2.709463368 3.844861119 0.871388075 4.412340759 3.68285E-05 2.106489496 5.583232741 2.106489496 5.583232741 X2 X3 3.626209704 1.561744216 2.321897316 0.023196713 0.51061528 6.741804127 0.51061528 6.741804127 X4 16.36166861 5.751501808 2.844764577 0.0058449464.887736593 27.83560063 4.887736593 27.83560063 What is the adjusted proportion of variability in Y explained by the predictor variables? 61.8% 21.1% 63.8% 78.9% 36.2% 79.9% A multiple regression model is run on a sample of data. Partial results are shown below. SUMMARY OUTPUT Regression Statistics Multiple R 0.79904012 R Square 0.638465113 Adjusted R Square 0.617506569 Standard Error 523.6198274 Observations 74 ANOVA df SS MS F Significance 4 33409364.7 8352341.175 30.46323773 1.31347E-14 Regression Residual 69 18918262.93 274177.7236 Total 73 52327627.63 Coefficients Standard Error t Stat P-value Lower 95% Upper 95% Lower 95.0% Upper 95.0% 180.3511585 -0.315779774 0.75312286 416.7419603 302.8394642 -416.7419603 302.8394642 -56.95124803 Intercept X1 0.265362203 8.215489021 8.06611E-12 1.650697161 2.709463368 1.650697161 2.709463368 2.180080265 3.844861119 X2 0.871388075 4.412340759 3.68285E-05 2.106489496 5.583232741 2.106489496 5.583232741 X3 3.626209704 1.561744216 2.321897316 0.023196713 0.51061528 6.741804127 0.51061528 6.741804127 5.751501808 2.844764577 0.0058449464.887736593 27.83560063 4.887736593 27.83560063 X4 16.36166861 What is the probability the overall model is NOT significant? About 64% About 20% About 100% About 0% About 80% About 36% An analyst performs the following simple regression analysis. SUMMARY OUTPUT Regression Statistics Multiple R 0.555310579 R Square 0.308369839 Adjusted R Square 0.305581007 Standard Error 322 2896211 Observations 250 ANOVA or SS Significance F 1.25978E-21 1 Regression Residual Total MS 11485291.45 11485291.45 110.5731 25759892.77 103870.5354 37245184.23 248 249 Intercept Coefficients Standard Error 1 Star P-value Lower 95% Upper 95% Lower 95.0% Upper 95.0% 1485.034019 62. 10252761 23.91261799 2.47E-66 1362.718396 1607.3496421362.718396 1607.349642 12.08565913 1.149332046 10.51537645 1.26E-21 9.821962781 14.34935549 9.821962781 14.34935549 What is the proportion of the variability in Y explained by the predictor variable? 55.5% 30.8% 30.6% 45.5% 69.2% 69.4%

Step by Step Solution

There are 3 Steps involved in it

1 Expert Approved Answer
Step: 1 Unlock blur-text-image
Question Has Been Solved by an Expert!

Get step-by-step solutions from verified subject matter experts

Step: 2 Unlock
Step: 3 Unlock

Students Have Also Explored These Related General Management Questions!