

Question: A multiple regression model is run on a sample of data. Partial results are shown below. SUMMARY OUTPUT Regression Statistics Multiple R R Square Adjusted
A multiple regression model is run on a sample of data. Partial results are shown below. SUMMARY OUTPUT Regression Statistics Multiple R R Square Adjusted R Square Standard Error Observations ANOVA Regression Residual Total Intercept X1 X2 X3 X4 About 0% About 80% O About 64% About 36% About 100% 0.79904012 0.638465113 0.617506569 523.6198274 What is the probability the overall model is NOT significant? About 20% df 74 4 69 73 SS MS F 33409364.7 8352341.175 30.46323773 18918262.93 274177.7236 52327627.63 Significance F 1.31347E-14 Coefficients Standard Error t Stat P-value Lower 95% Upper 95% Lower 95.0% Upper 95.0% -56.95124803 180.3511585 -0.315779774 0.75312286 -416.7419603 302.8394642 -416.7419603 302.8394642 2.180080265 0.265362203 8.215489021 8.06611E-12 1.650697161 2.709463368 1.650697161 2.709463368 3.844861119 0.871388075 4.412340759 3.68285E-05 2.106489496 5.583232741 2.106489496 5.583232741 3.626209704 1.561744216 2.321897316 0.023196713 0.51061528 6.741804127 0.51061528 6.741804127 16.36166861 5.751501808 2.844764577 0.005844946 4.887736593 27.83560063 4.887736593 27.83560063
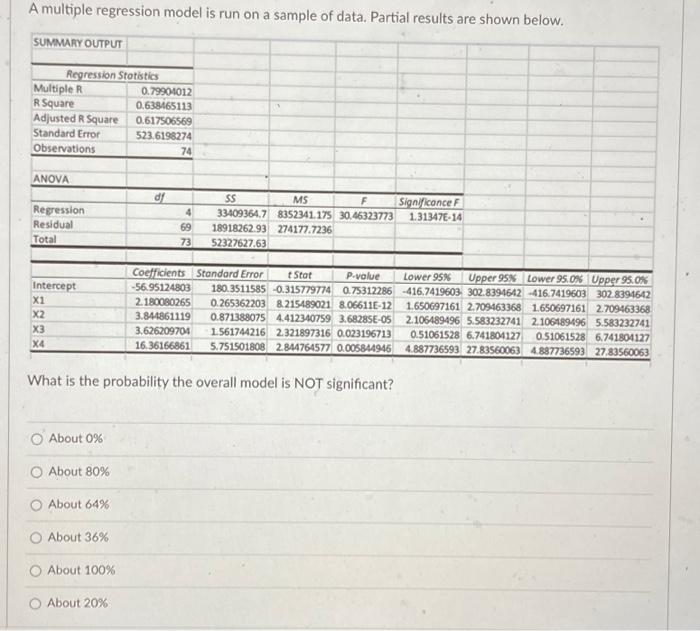
A multiple regression model is run on a sample of data. Partial results are shown below. What is the probability the overall model is NOT significant? About 0% About 80% About 64% About 36% About 100% About 20%
Step by Step Solution
There are 3 Steps involved in it
1 Expert Approved Answer
Step: 1 Unlock

Question Has Been Solved by an Expert!
Get step-by-step solutions from verified subject matter experts
Step: 2 Unlock
Step: 3 Unlock