

Question: (a) Normalize the table above into First Normal Form. Draw its dependency diagram and identify all dependencies, including all partial and transitive dependencies. (9 marks)
(a) Normalize the table above into First Normal Form. Draw its dependency diagram and identify all dependencies, including all partial and transitive dependencies. (9 marks)
(b) Normalize the relation into Second Normal Form (2NF). Draw the diagram or produce the relational schema and identify all dependencies, including all partial and transitive dependencies. (7 marks)
(c) From the Second Normal Form produced in (b), further normalize the relations into Third Normal Form (3NF) by producing the diagram or the relational schema. (6 marks)
(d) Describe the following data models: (3 marks) i) Object-oriented model ii) Network model.
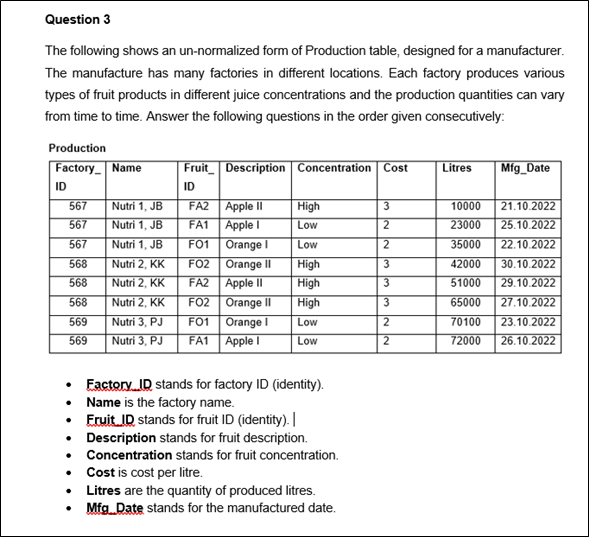
The following shows an un-normalized form of Production table, designed for a manufacturer. The manufacture has many factories in different locations. Each factory produces various types of fruit products in different juice concentrations and the production quantities can vary from time to time. Answer the following questions in the order given consecutively: Production - Factory ID stands for factory ID (identity). - Name is the factory name. - Fruit ID stands for fruit ID (identity). - Description stands for fruit description. - Concentration stands for fruit concentration. - Cost is cost per litre. - Litres are the quantity of produced litres. - Mfg_Date stands for the manufactured date
Step by Step Solution
There are 3 Steps involved in it

Get step-by-step solutions from verified subject matter experts