

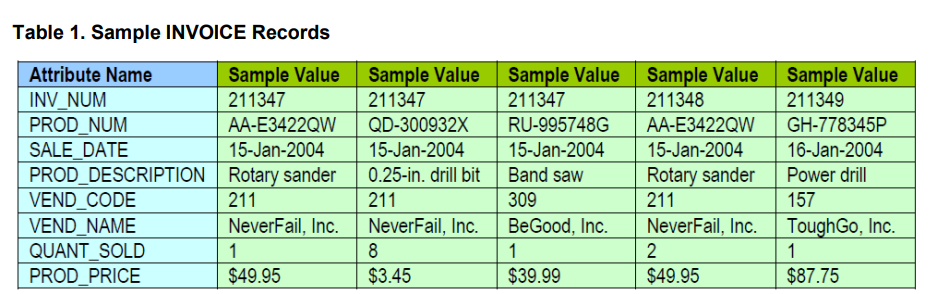
Question: Tasks to do 1 . Using the INVOICE table structure shown in Table 1 ( note that in this table rows are attributes and columns
Tasks to do
Using the INVOICE table structure shown in Table note that in this table rows are attributes and columns
are data records draw its dependency diagram and identifyall dependencies including all partial and
transitive dependencies You can see that an invoice has more than one product and a product is in more
than one invoice. From the business rules, we know that a product is supplied by one vendor only, but a
vendor can supply many products.
Note that you first need to determine the Primary Key to identify partial and transitive dependencies. What
do you think can be the Primary Key in this table? Note that it is a minimal candidate key that can uniquely
identify every records.
Using the initial dependency diagram drawn for Question remove all partial dependencies and
draw dependency diagrams of new table structures. Note that your actions may result in multiple tables.
Using the tables structures you created for Question remove transitive dependencies in all tables
Page of
and draw dependency diagrams of all tables.
Your might have multiple tables by now. For each table, please check if they satisfy conditions for NF
NF and NF and justify why they do or do not satisfy.
Using the table structures from Question draw a complete Entity Relationship Diagram ERD of the
database using Crow Foot notations in your choice of professional tool Visio Lucidchat or draw.io
NOTE: Because the dependency diagrams cannot show the nature ::M M:N of the relationships, the
ERD remains crucial to the design effort. Complex design is impossible to produce successfully without
some form of modelling such as ERD. Yet, as the preceding decompositions demonstrate, the dependency
diagrams are a valuable addition to the designer's toolbox. Normalization is likely to add tablesentities that
may not have been considered during the initial conceptual modelling process. Therefore, initial ERD may
change after normalizationTable Sample INVOICE Records
tableAttribute Name,Sample Value,Sample Value,Sample Value,Sample Value,Sample ValueINVNUM,PRODNUM,AAEQWQDXRUGAAEQWGHPSALEDATE,JanJanJanJanJanPRODDESCRIPTION,Rotary sander,in drill bit,Band saw,Rotary sander,Power drillVENDCODE,VENDNAME,NeverFail, Inc.,NeverFail, Inc.,BeGood, Inc.,NeverFail, Inc.,ToughGo, Inc.QUANTSOLD,PRODPRICE,$$$$$
Step by Step Solution
There are 3 Steps involved in it
1 Expert Approved Answer
Step: 1 Unlock

Question Has Been Solved by an Expert!
Get step-by-step solutions from verified subject matter experts
Step: 2 Unlock
Step: 3 Unlock