

Question: A nurse recorded the values shown in the table for a patient's temperature. Plot a graph of temperature versus time and find (a) the patient's

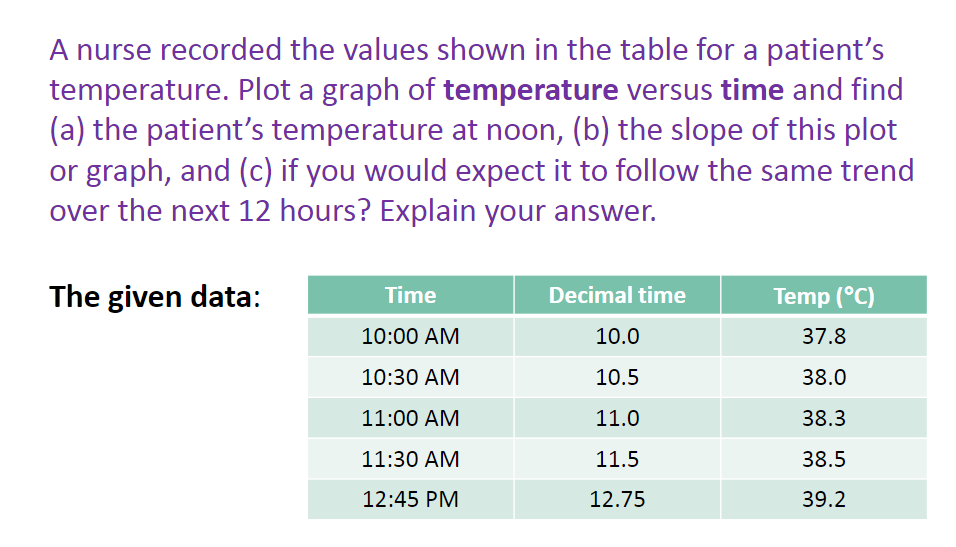
A nurse recorded the values shown in the table for a patient's temperature. Plot a graph of temperature versus time and find (a) the patient's temperature at noon, (b) the slope of this plot or graph, and (c) if you would expect it to follow the same trend over the next 12 hours? Explain your answer. The given data: Tempm 10:00 AM 10.0 37.8 10:30 AM 10.5 38.0 11:00 AM 11.0 38.3 11:30 AM 11.5 38.5 12:45 PM 12.75 39.2
Step by Step Solution
There are 3 Steps involved in it
1 Expert Approved Answer
Step: 1 Unlock

Question Has Been Solved by an Expert!
Get step-by-step solutions from verified subject matter experts
Step: 2 Unlock
Step: 3 Unlock