Question: a) On a sheet of graph paper, construct the Time Series plot and explain what pattern exists in the given data. . b) Write out
a) On a sheet of graph paper, construct the Time Series plot and explain what pattern exists in the given data.
.
b) Write out the Linear trend equation that provides the best fit for the given 7 data points.
.
c) Write out the forecast for year 2010 and the MSE for this forecast based on this Linear trend.
.
d) Write out the forecast for the next 8 years (thru the year 2017) based on this linear trend.
.
e) Use exponential smoothing with =0.2 to develop a forecast thru year 2010 for the given data. Find the MSE for this forecast.
.
f) Explain which of these methods provides the better forecast based on MSE.
.
g) If the LINEAR trend equation is used, in what year will this company achieve a level lower than 5% ?
.
Scan your answers to parts a, b, c, d, e, f, g and submit by clicking on the words "Chap 15 - Prob #22" above.
MAKE SURE THAT YOU CLEARLY IDENTIFY THE ANSWERS TO EACH PART (a) THRU (g).
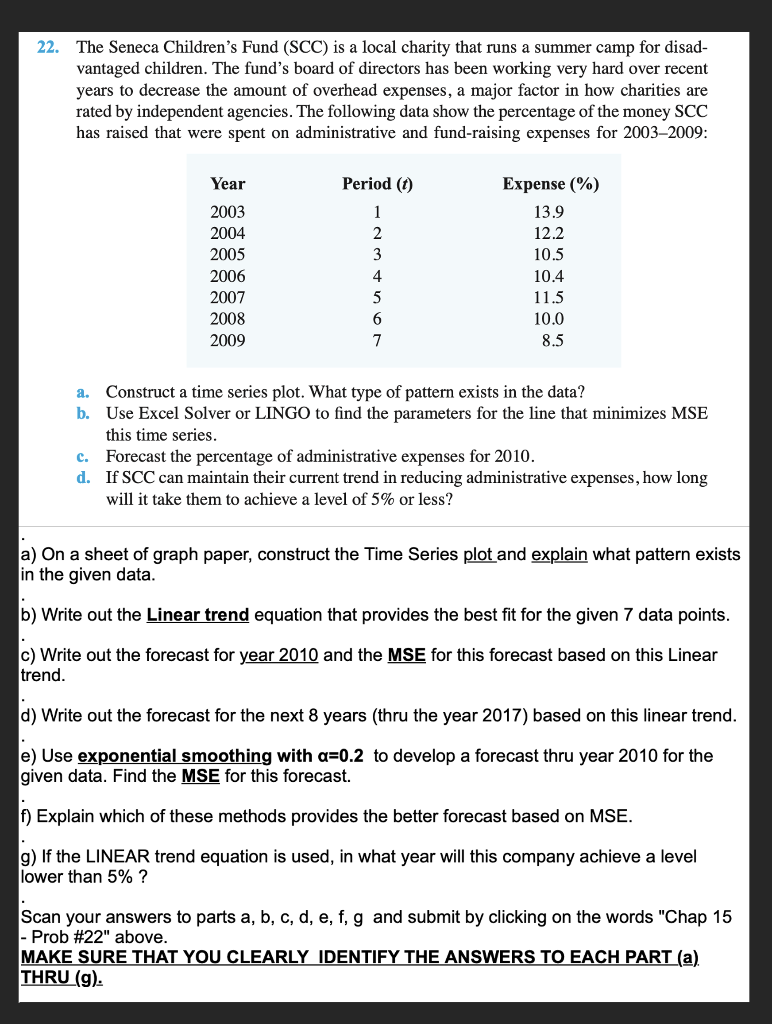
22. The Seneca Children's Fund (SCC) is a local charity that runs a summer camp for disadvantaged children. The fund's board of directors has been working very hard over recent years to decrease the amount of overhead expenses, a major factor in how charities are rated by independent agencies. The following data show the percentage of the money SCC has raised that were spent on administrative and fund-raising expenses for 2003-2009: a. Construct a time series plot. What type of pattern exists in the data? b. Use Excel Solver or LINGO to find the parameters for the line that minimizes MSE this time series. c. Forecast the percentage of administrative expenses for 2010 . d. If SCC can maintain their current trend in reducing administrative expenses, how long will it take them to achieve a level of 5% or less? a) On a sheet of graph paper, construct the Time Series plot and explain what pattern exists in the given data. b) Write out the Linear trend equation that provides the best fit for the given 7 data points. c) Write out the forecast for year 2010 and the MSE for this forecast based on this Linear trend. d) Write out the forecast for the next 8 years (thru the year 2017) based on this linear trend. e) Use exponential smoothing with =0.2 to develop a forecast thru year 2010 for the given data. Find the MSE for this forecast. f) Explain which of these methods provides the better forecast based on MSE. g) If the LINEAR trend equation is used, in what year will this company achieve a level lower than 5% ? Scan your answers to parts a, b, c, d, e, f, g and submit by clicking on the words "Chap 15 - Prob \#22" above. MAKE SURE THAT YOU CLEARLY IDENTIFY THE ANSWERS TO EACH PART (a). THRU (g)


