

Question: Test Information Description Instructions for each question, select the BEST answer and click on the corresponding radio button for your answer next to the appropriate
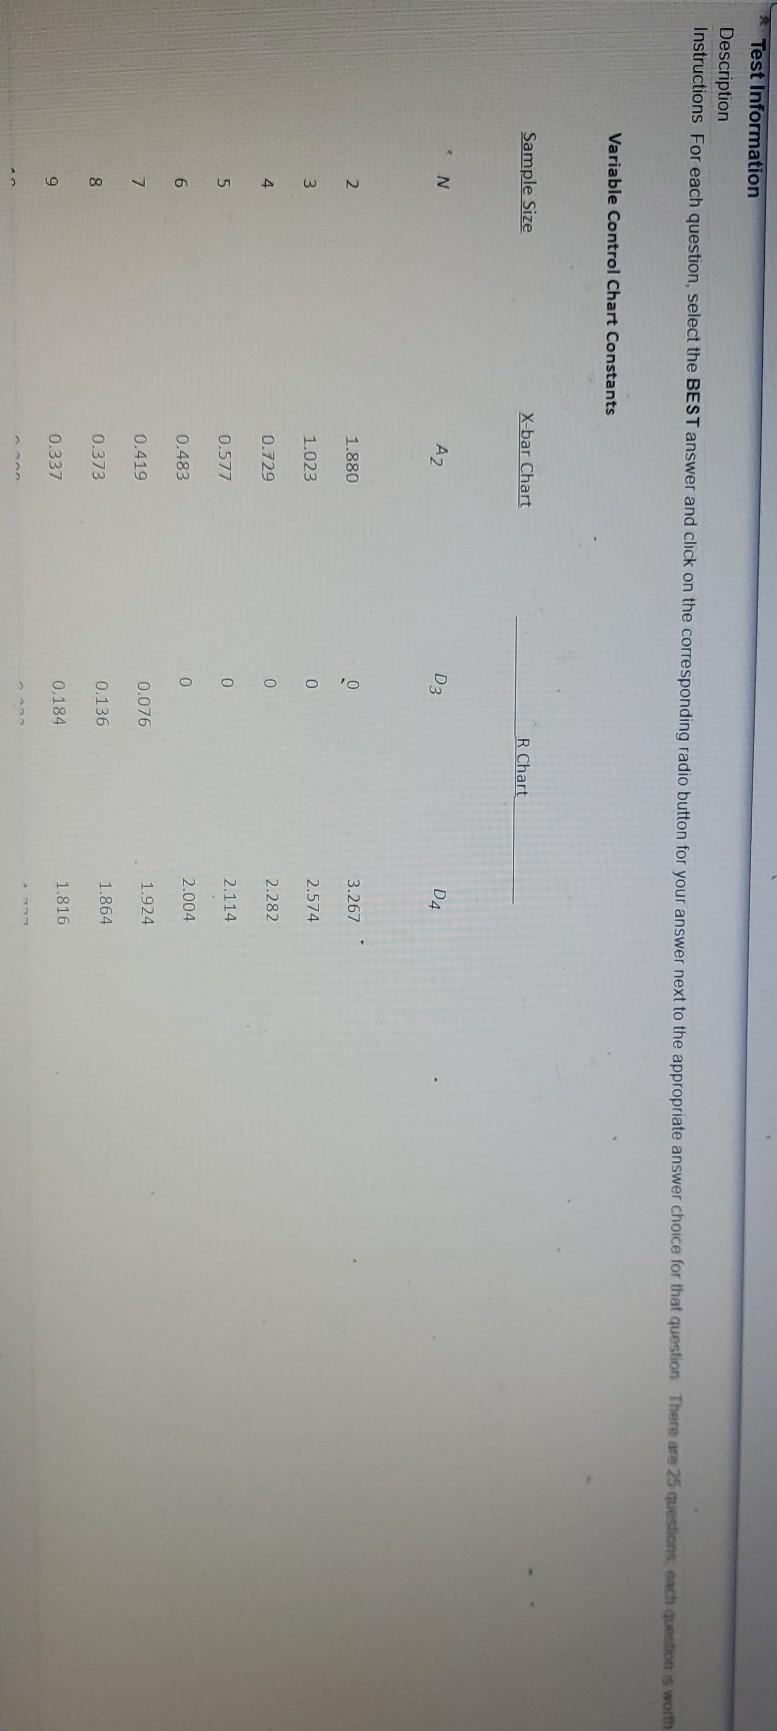
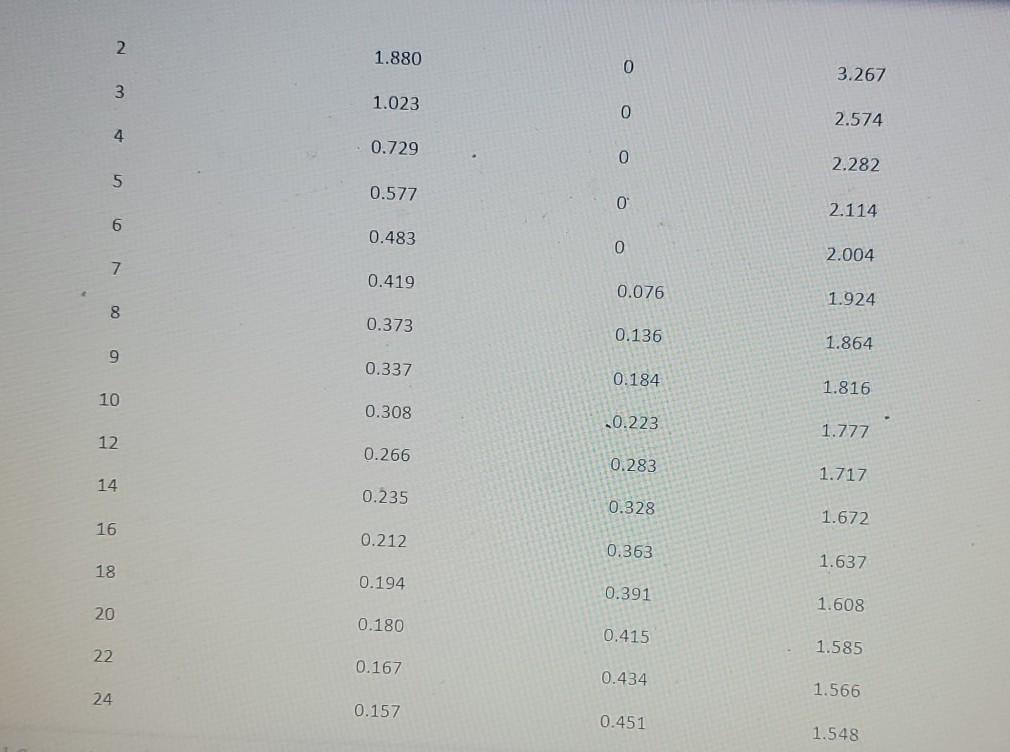
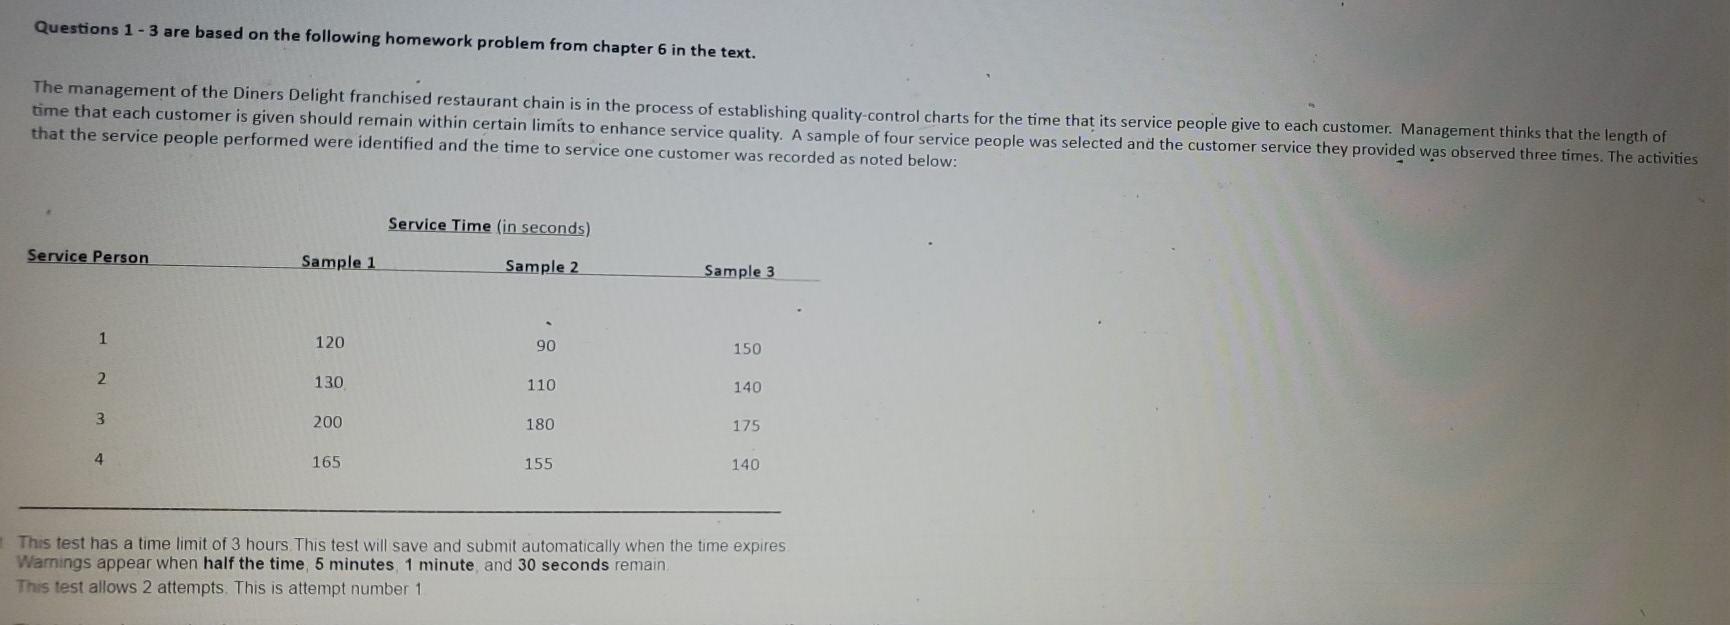
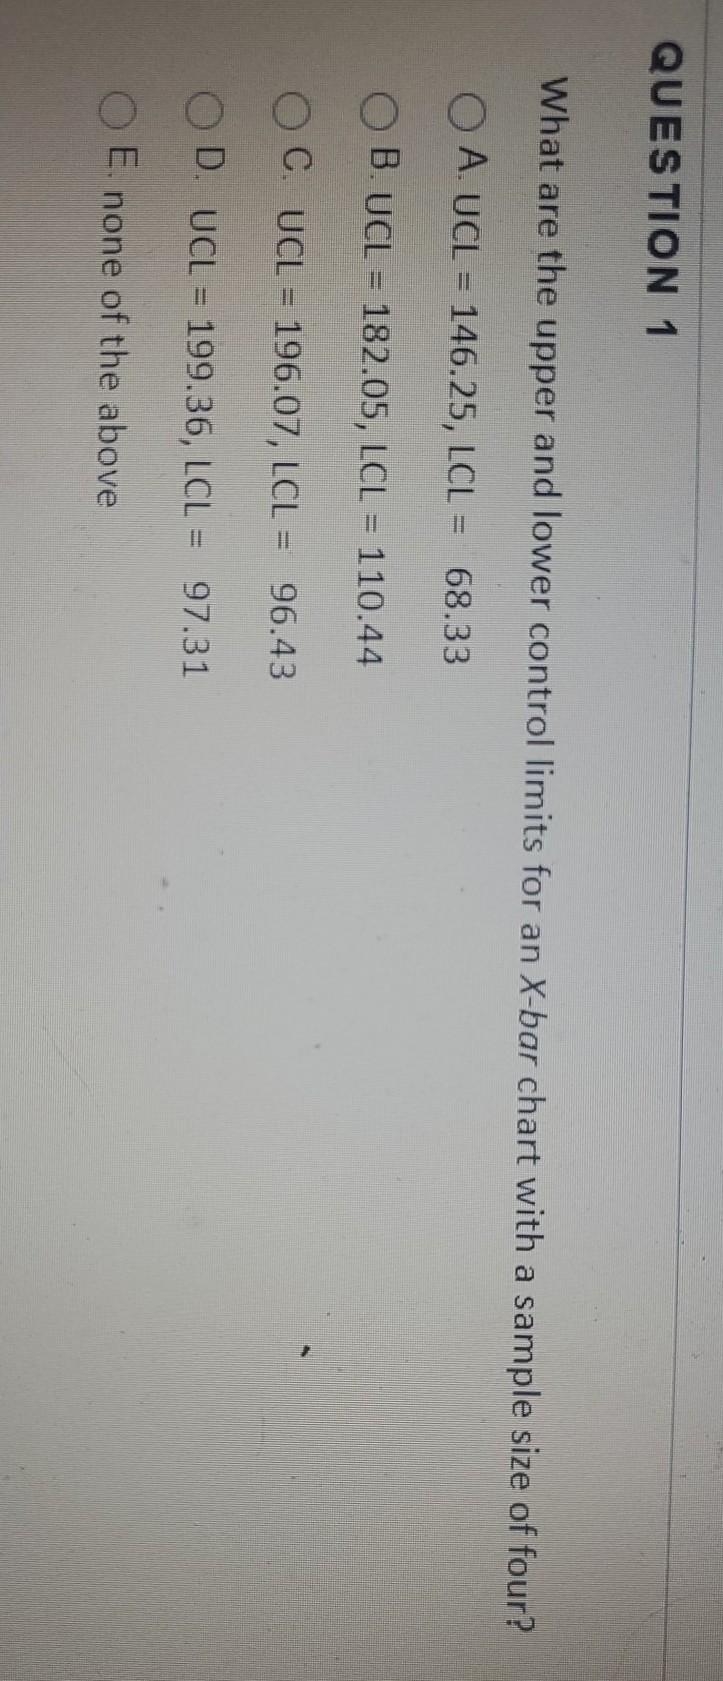
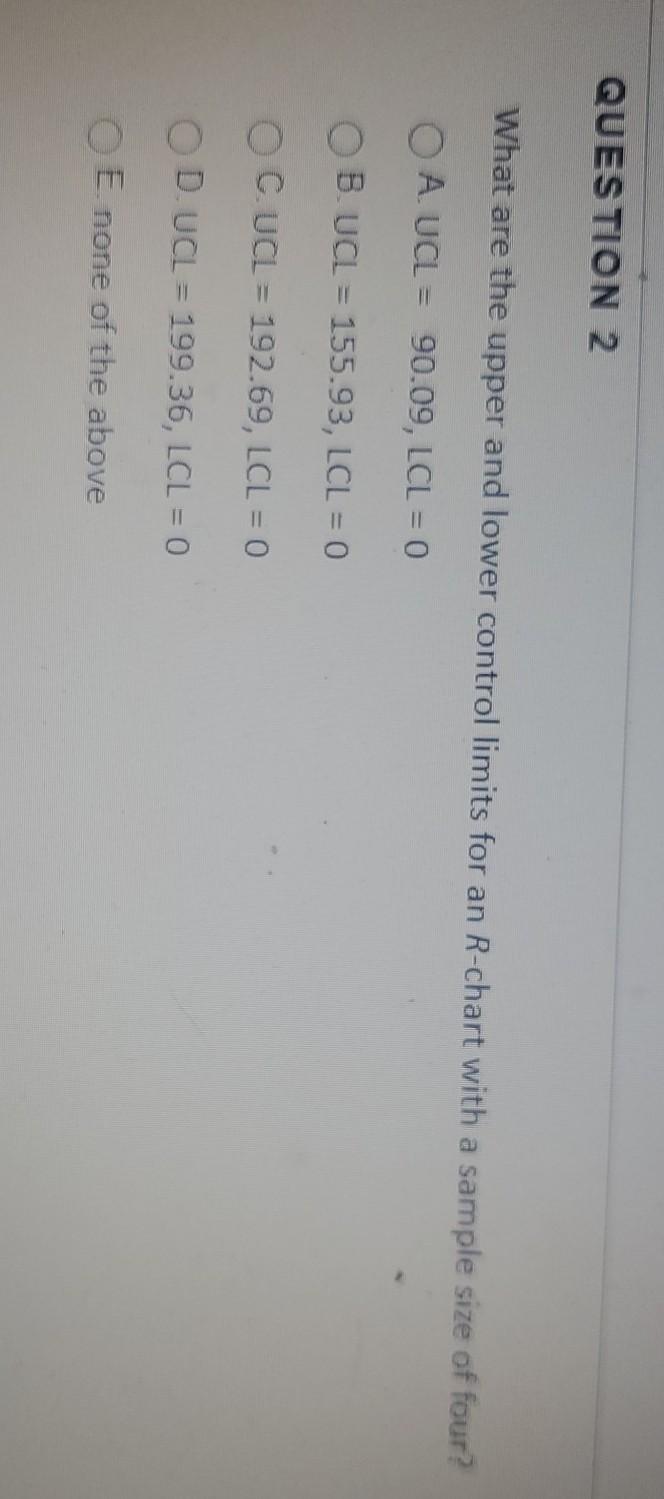
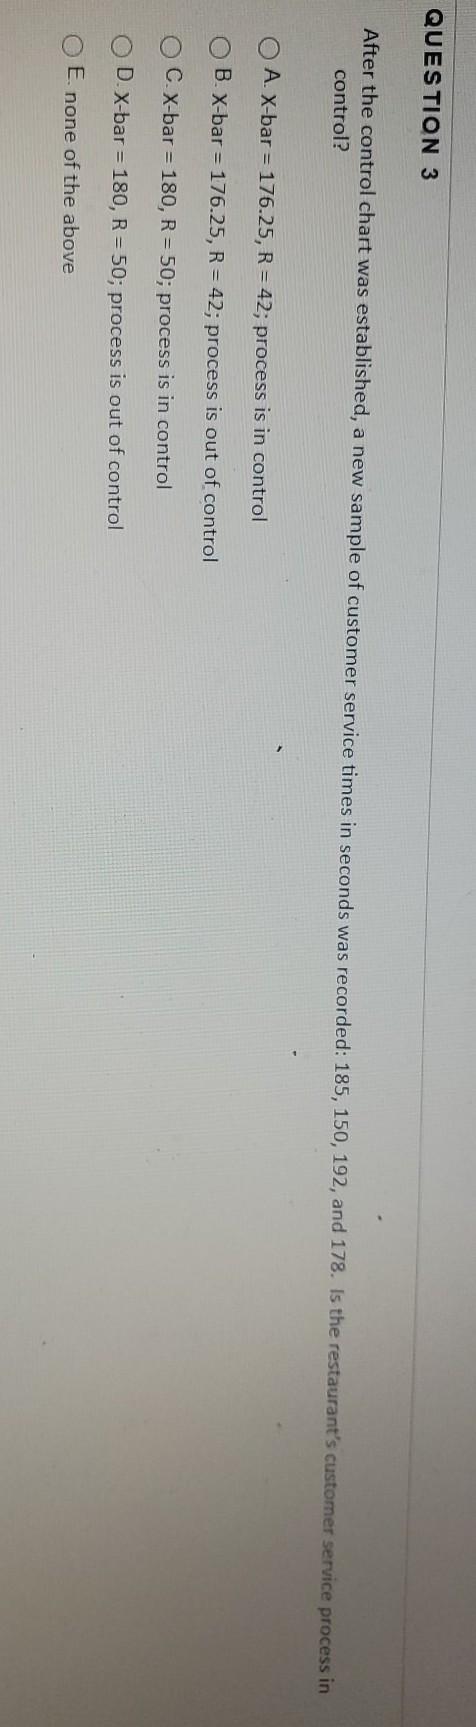
Test Information Description Instructions for each question, select the BEST answer and click on the corresponding radio button for your answer next to the appropriate answer choice for that question. There are 25 questions each question is worth Variable Control Chart Constants Sample Size X-bar Chart R Chart N AZ D3 D4 2 1.880 3.267 3 1.023 0 2.574 4 0.729 0 2.282 5 0.577 0 2.114 6 0.483 0 2.004 0.419 7 1.924 0.076 0.373 8 1.864 0.136 0.337 9. 1.816 0.184 2 1.880 0 3.267 3 1.023 2.574 4 0.729 0 2.282 S 0.577 " 2.114 6 0.483 2.004 7 0.419 0.076 1.924 8 0.373 0.136 1.864 9 0.337 0.184 1.816 10 0.308 0.223 1.777 12 0.266 0.283 1.717 14 0.235 0.328 1.672 16 0.212 0.363 1.637 18 0.194 0.391 1.608 20 0.180 0.415 1.585 22 0.167 0.434 1.566 24 0.157 0.451 1.548 Questions 1 - 3 are based on the following homework problem from chapter 6 in the text. The management of the Diners Delight franchised restaurant chain is in the process of establishing quality control charts for the time that its service people give to each customer. Management thinks that the length of time that each customer is given should remain within certain limits to enhance service quality. A sample of four service people was selected and the customer service they provided was observed three times. The activities that the service people performed were identified and the time to service one customer was recorded as noted below: Service Time (in seconds) Service Person Sample 1 Sample 2 Sample 3 1 120 90 150 2 130 110 140 3 200 180 175 4 165 155 140 This test has a time limit of 3 hours. This test will save and submit automatically when the time expires Wamings appear when half the time 5 minutes 1 minute and 30 seconds remain This test allows 2 attempts. This is attempt number 1 QUESTION 1 What are the upper and lower control limits for an X-bar chart with a sample size of four? OA. UCL = 146.25, LCL = 68.33 OB.UCL = 182.05, LCL = 110.44 OC. UCL = 196.07, LCL = 96.43 OD. UCL = 199.36, LCL = 97.31 O E. none of the above QUESTION 2 What are the upper and lower control limits for an R-chart with a sample size of four? O A UCL = 90.09, LCL = 0 OB.UCL = 155.93, LCL = 0 OC UCL = 192.69, LCL = 0 OD UCL = 199.36, LCL = 0 O E none of the above QUESTION 3 After the control chart was established, a new sample of customer service times in seconds was recorded: 185, 150, 192, and 178. Is the restaurant's customer service process in control? O A. X-bar = 176.25, R = 42; process is in control OB. X-bar = 176.25, R = 42; process is out of control O CX-bar = 180, R = 50; process is in control OD. X-bar = 180, R = 50; process is out of control E. none of the above
Step by Step Solution
There are 3 Steps involved in it
1 Expert Approved Answer
Step: 1 Unlock

Question Has Been Solved by an Expert!
Get step-by-step solutions from verified subject matter experts
Step: 2 Unlock
Step: 3 Unlock