

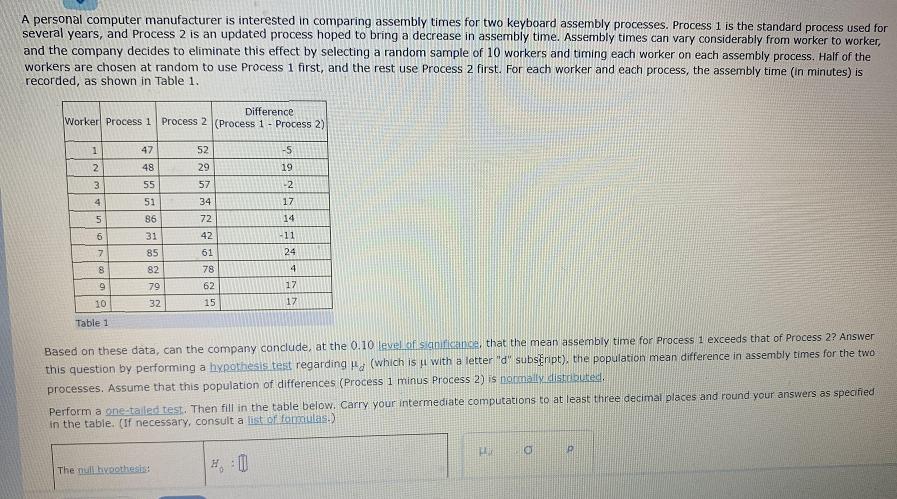
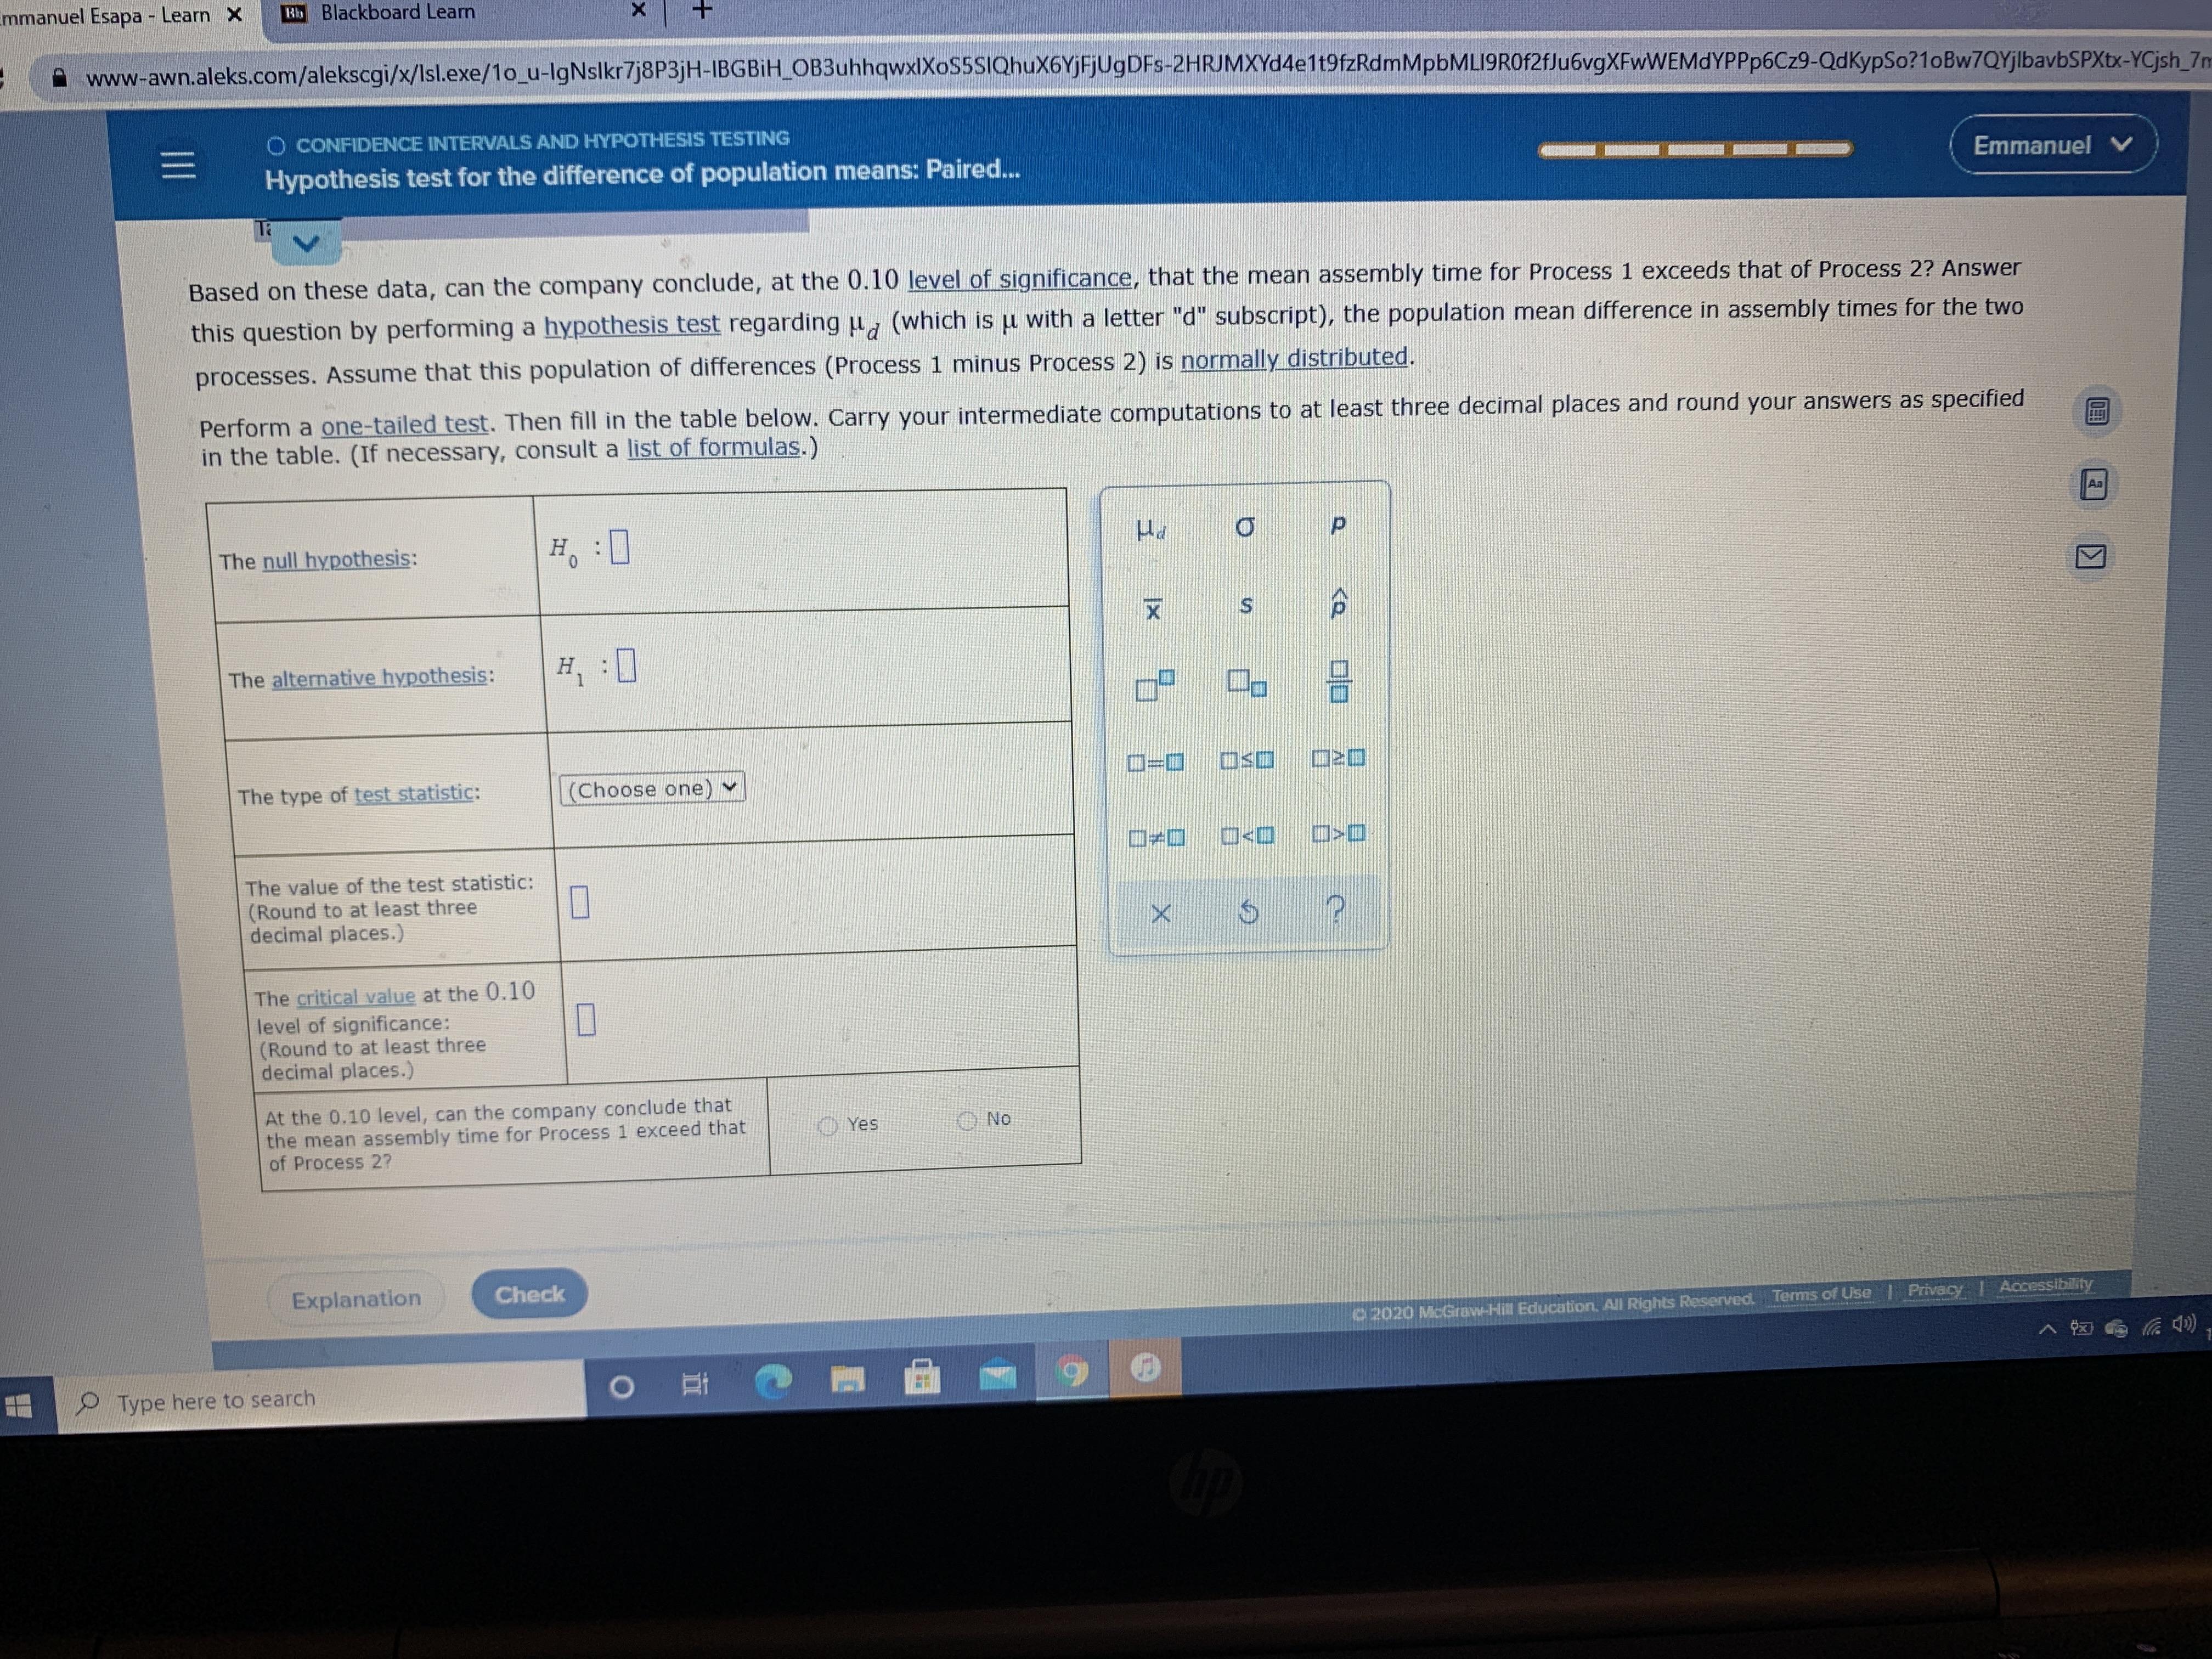
A personal computer manufacturer is interested in comparing assembly times for two keyboard assembly processes. Process...
Fantastic news! We've Found the answer you've been seeking!
Question:
Transcribed Image Text:
A personal computer manufacturer is interested in comparing assembly times for two keyboard assembly processes. Process 1 is the standard process used for several years, and Process 2 is an updated process hoped to bring a decrease in assembly time. Assembly times can vary considerably from worker to worker, and the company decides to eliminate this effect by selecting a random sample of 10 workers and timing each worker on each assembly process. Half of the workers are chosen at random to use Process 1 first, and the rest use Process 2 first. For each worker and each process, the assembly time (in minutes) is recorded, as shown in Table 1. Difference Worker Process 1 Process 2 (Process 1 - Process 2) 47 52 -5 48 29 19 3 55 57 -2 4. 51 34 17 86 72 14 31 42 -11 85 61 24 82 78 4 79 62 17 10 32 15 17 Table 1 Based on these data, can the company conclude, at the 0.10 level of sianificance, that the mean assembly time for Process 1 exceeds that of Process 2? Answer this question by performing a hypothesis test regarding u (which is u with a letter "d" substipt), the population mean difference in assembly times for the two processes. Assume that this population of differences (Proces 1 minus Process 2) is notmally distributed. Perform a one-taled test. Then fill in the table below. Carry your intermediate computations to at least three decimal places and round your answers as specified in the table. (If necessary, consult a list of formulas.) The null hvoothesis: Emmanuel Esapa - Learn X Rh Blackboard Learn www-awn.aleks.com/alekscgi/x/Isl.exe/1o_u-lgNslkr7j8P3jH-IBGBİH_OB3uhhqwxlXoS5SIQhuX6YjFjUgDFs-2HRJMXYd4e1t9fzRdmMpbMLI9ROf2fJu6vgXFwWEMdYPPp6Cz9-QdKypSo?1oBw7QYjlbavbSPXtx-YCjsh_7m O CONFIDENCE INTERVALS AND HYPOTHESIS TESTING Hypothesis test for the difference of population means: Paired... Emmanuel V Based on these data, can the company conclude, at the 0.10 level of significance, that the mean assembly time for Process 1 exceeds that of Process 2? Answer this question by performing a hypothesis test regarding (which is u with a letter "d" subscript), the population mean difference in assembly times for the two processes. Assume that this population of differences (Process 1 minus Process 2) is normally distributed. Perform a one-tailed test. Then fill in the table below. Carry your intermediate computations to at least three decimal places and round your answers as specified in the table. (If necessary, consult a list of formulas.) An The null hypothesis: H, :0 区 The alternative hypothesis: H, :0 Ca号 ロ=ロ The type of test statistic: Choose one) ♥ ロRロ O<O The value of the test statistic: (Round to at least three decimal places.) The critical value at the 0.10 level of significance: (Round to at least three decimal places.) At the 0.10 level, can the company conclude that the mean assembly time for Process 1 exceed that of Process 27 O Yes O No Explanation Check 2020 McGraw-Hill Education, All Rights Reserved. Temis of Use | Privacy Accessibility ヘ図 の Type here to search の A personal computer manufacturer is interested in comparing assembly times for two keyboard assembly processes. Process 1 is the standard process used for several years, and Process 2 is an updated process hoped to bring a decrease in assembly time. Assembly times can vary considerably from worker to worker, and the company decides to eliminate this effect by selecting a random sample of 10 workers and timing each worker on each assembly process. Half of the workers are chosen at random to use Process 1 first, and the rest use Process 2 first. For each worker and each process, the assembly time (in minutes) is recorded, as shown in Table 1. Difference Worker Process 1 Process 2 (Process 1 - Process 2) 47 52 -5 48 29 19 3 55 57 -2 4. 51 34 17 86 72 14 31 42 -11 85 61 24 82 78 4 79 62 17 10 32 15 17 Table 1 Based on these data, can the company conclude, at the 0.10 level of sianificance, that the mean assembly time for Process 1 exceeds that of Process 2? Answer this question by performing a hypothesis test regarding u (which is u with a letter "d" substipt), the population mean difference in assembly times for the two processes. Assume that this population of differences (Proces 1 minus Process 2) is notmally distributed. Perform a one-taled test. Then fill in the table below. Carry your intermediate computations to at least three decimal places and round your answers as specified in the table. (If necessary, consult a list of formulas.) The null hvoothesis: Emmanuel Esapa - Learn X Rh Blackboard Learn www-awn.aleks.com/alekscgi/x/Isl.exe/1o_u-lgNslkr7j8P3jH-IBGBİH_OB3uhhqwxlXoS5SIQhuX6YjFjUgDFs-2HRJMXYd4e1t9fzRdmMpbMLI9ROf2fJu6vgXFwWEMdYPPp6Cz9-QdKypSo?1oBw7QYjlbavbSPXtx-YCjsh_7m O CONFIDENCE INTERVALS AND HYPOTHESIS TESTING Hypothesis test for the difference of population means: Paired... Emmanuel V Based on these data, can the company conclude, at the 0.10 level of significance, that the mean assembly time for Process 1 exceeds that of Process 2? Answer this question by performing a hypothesis test regarding (which is u with a letter "d" subscript), the population mean difference in assembly times for the two processes. Assume that this population of differences (Process 1 minus Process 2) is normally distributed. Perform a one-tailed test. Then fill in the table below. Carry your intermediate computations to at least three decimal places and round your answers as specified in the table. (If necessary, consult a list of formulas.) An The null hypothesis: H, :0 区 The alternative hypothesis: H, :0 Ca号 ロ=ロ The type of test statistic: Choose one) ♥ ロRロ O<O The value of the test statistic: (Round to at least three decimal places.) The critical value at the 0.10 level of significance: (Round to at least three decimal places.) At the 0.10 level, can the company conclude that the mean assembly time for Process 1 exceed that of Process 27 O Yes O No Explanation Check 2020 McGraw-Hill Education, All Rights Reserved. Temis of Use | Privacy Accessibility ヘ図 の Type here to search の
Expert Answer:

Related Book For 

Business Statistics a decision making approach
ISBN: 978-0133021844
9th edition
Authors: David F. Groebner, Patrick W. Shannon, Phillip C. Fry
Posted Date:
Students also viewed these mathematics questions
-
A personal computer manufacturer is interested in comparing assembly times for two keyboard assembly processes. Assembly times can vary considerably from worker to worker, and the company decides to...
-
A manufacturer of automobile shock absorbers is interested in comparing the durability of its shocks with that of its two biggest competitors. To make the comparison, a set of one each of the...
-
A political science professor is interested in comparing the characteristics of students who do and do not vote in national elections. For a random sample of 114 students who claimed to have voted in...
-
Your client has offered a 5-year, $1,000 par value bond with a 10 percent coupon. Interest on this bond is paid quarterly. 1) If your client is to earn a nominal rate of return of 12 percent,...
-
A couple has n children, where n > 1 is fixed. They are not all girls. What is the probability of exactly j boys (where j > 1)?
-
A firm has 2,000,000 shares of common stock outstanding with a market price of $2.00 each. It has 2,000 bonds outstanding, each with a market value of $1,200 (120 percent of face). The bonds mature...
-
Outline how standard desktop applications such as a spreadsheet or database can be used to set up a basic T&D system.
-
Sprint Nextel is one of the largest digital wireless service providers in the United States. In a recent year, it had approximately 32.5 million direct subscribers (accounts) that generated revenue...
-
What will be a great strategic recommendation to overcome Buyer Power for T-Mobile. The strategic recommendation needs to be something that has not been proposed before. Any suggestions will help.
-
Complete Form 941 for the 4th quarter for TCLH Industries (which is located at 202 Whitmore Avenue, Durham, NC 27701; Employer Identification #44-4444444). Assume that all necessary deposits were...
-
2. (45 marks) We are given the following algebraic model: 4x1 + 9x2 maximize subject to (1) (2) (3) 10x + 8x2 < 420 (4) 4x + 20x2 < 588 15x + 3x2 < 450 40x10x2 2 400 x2 > (a) Solve the model...
-
Define and discuss the following terms: tubular goods gathering systems workover operations shut-in payments
-
When are companies required to remeasure AROs, and what types of changes result in the re-measurement? How are changes recorded?
-
Define the following terms: asset retirement obligation retirement accretion promissory estoppel legally enforceable obligation obligating event
-
Define the following terms: impairment asset group traditional present value approach expected present value approach
-
The _________ ratio is used to approximate or measure the number of years that production could continue at the current rate if no new reserves were added. a. Reserve life b. Reserve replacement c....
-
Perseus, a manufacturer of luxury clothes wholly owned by its owner-manager, is considering introducing a new range of coats made from baby sea lions. The project requires an initial investment of...
-
Review Exhibit 11.4. Analyze each product on the graph according to the characteristics that influence the rate of adoption. For example, what can you conclude from the data about the relative...
-
In any of the multiple comparison techniques (Tukey-Kramer, LSD ), the estimate of the within-sample variance uses data from the entire experiment. However, if one were to do a two-sample t -test to...
-
The following population is provided: Further, a simple random sample from this population gives the following values: Compute the sampling error for the sample mean in this situation. 17 15 8 12 9 7...
-
A regional retailer would like to determine if the variation in average monthly store sales can, in part, be explained by the size of the store measured in square feet. A random sample of 21 stores...
-
What are the numbers of observations in each of the five categories that rate the respondents level of job satisfaction?
-
Which of the seven store departments had the most customer visits, and what was this number?
-
How many individuals are in each of the five different credit card categories?

Study smarter with the SolutionInn App