

Question: A personal computer manufacturer is interested in comparing assembly times for two keyboard assembly processes. Assembly times can vary considerably from worker to worker,
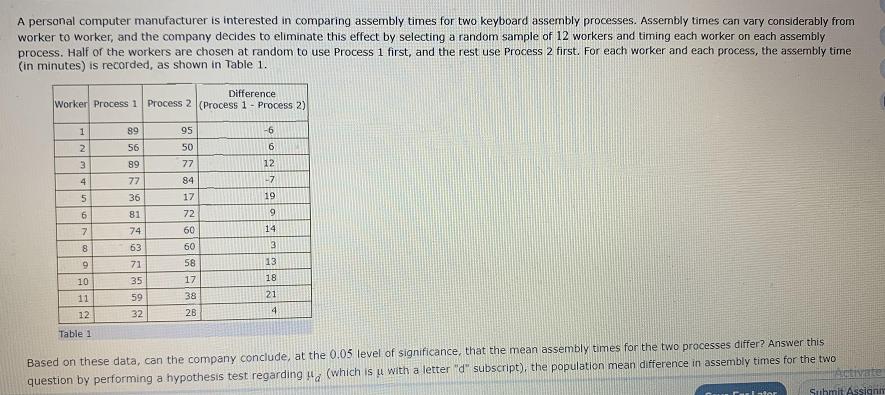
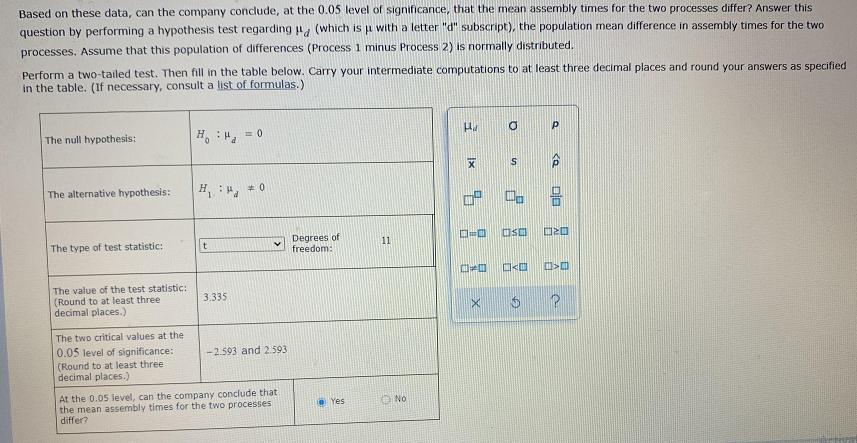
A personal computer manufacturer is interested in comparing assembly times for two keyboard assembly processes. Assembly times can vary considerably from worker to worker, and the company decides to eliminate this effect by selecting a random sample of 12 workers and timing each worker on each assembly process. Half of the workers are chosen at random to use Process 1 first, and the rest use Process 2 first. For each worker and each process, the assembly time (in minutes) is recorded, as shown in Table 1. Difference Worker Process 1 Process 2 (Process 1- Process 2) 1 89 95 -6 2. 56 50 3 89 77 12 4 77 84 -7 36 17 19 81 72 7 74 60 14 63 60 3 71 58 13 10 35 17 18 11 59 38 21 12 32 28 4 Table 1 Based on these data, can the company conclude, at the 0.05 level of significance, that the mean assembly times for the two processes differ? Answer this tivate question by performing a hypothesis test regarding u (which is u with a letter "d" subscript), the population mean difference in assembly times for the two Suhmit Assignm Carlntor Based on these data, can the company conclude, at the 0.05 level of significance, that the mean assembly times for the two processes differ? Answer this question by performing a hypothesis test regarding (which is u with a letter "d" subscript), the population mean difference in assembly times for the two processes. Assume that this population of differences (Process 1 minus Process 2) is normally distributed. Perform a two-tailed test. Then fill in the table below. Carry your intermediate computations to at least three decimal places and round your answers as specified in the table. (If necessary, consult a list of formulas.) The null hypothesis: The alternative hypothesis: H Degrees of freedom: The type of test statistic: 11 The value of the test statistic: (Round to at least three decimal places.) 3.335 The two critical values at the 0.05 level of significance: (Round to at least three decimal places.) -2.593 and 2 593 At the 0.05 level, can the company conclude that the mean assembly times for the two processes differ? Yes O No
Step by Step Solution
3.31 Rating (157 Votes )
There are 3 Steps involved in it
Difference d d dbar d dbar2 6 14833 22001... View full answer

Get step-by-step solutions from verified subject matter experts