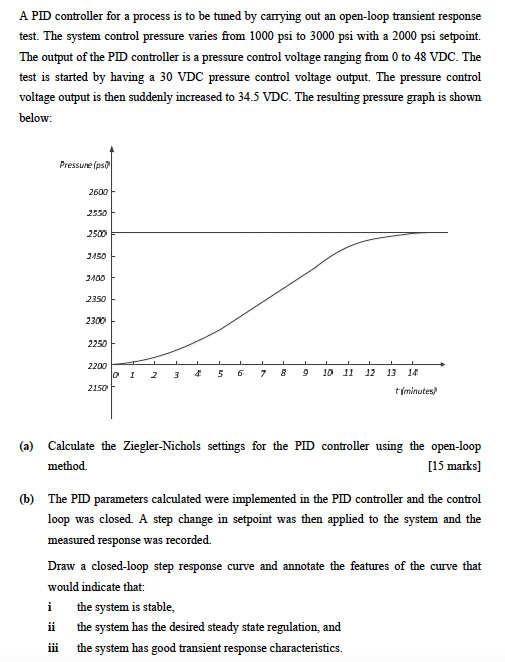
Question: A PID controller for a process is to be tuned by carrying out an open-loop transient response test. The system control pressure varies from 1000

A PID controller for a process is to be tuned by

A PID controller for a process is to be tuned by carrying out an open-loop transient response test. The system control pressure varies from 1000 psi to 3000 psi with a 2000 psi setpoint. The output of the PID controller is a pressure control voltage ranging from 0 to 48 VDC. The test is started by having a 30 VDC pressure control voltage output. The pressure control voltage output is then suddenly increased to 34.5 VDC. The resulting pressure graph is shown below: Pressure (ps 2600 2500 2450 2400 2350 2300 2250 1 1 1 2200 1 8 1 9 0 1 4 2 5 7 10 11 12 13 14 2150 tminutes (a) Calculate the Ziegler-Nichols settings for the PID controller using the open-loop method. [15 marks] (b) The PID parameters calculated were implemented in the PID controller and the control loop was closed. A step change in setpoint was then applied to the system and the measured response was recorded. Draw a closed-loop step response curve and annotate the features of the curve that would indicate that: the system is stable, the system has the desired steady state regulation, and the system has good transient response characteristics. ii iii A PID controller for a process is to be tuned by carrying out an open-loop transient response test. The system control pressure varies from 1000 psi to 3000 psi with a 2000 psi setpoint. The output of the PID controller is a pressure control voltage ranging from 0 to 48 VDC. The test is started by having a 30 VDC pressure control voltage output. The pressure control voltage output is then suddenly increased to 34.5 VDC. The resulting pressure graph is shown below: Pressure (ps 2600 2500 2450 2400 2350 2300 2250 1 1 1 2200 1 8 1 9 0 1 4 2 5 7 10 11 12 13 14 2150 tminutes (a) Calculate the Ziegler-Nichols settings for the PID controller using the open-loop method. [15 marks] (b) The PID parameters calculated were implemented in the PID controller and the control loop was closed. A step change in setpoint was then applied to the system and the measured response was recorded. Draw a closed-loop step response curve and annotate the features of the curve that would indicate that: the system is stable, the system has the desired steady state regulation, and the system has good transient response characteristics

Step by Step Solution

There are 3 Steps involved in it

1 Expert Approved Answer
Step: 1 Unlock blur-text-image
Question Has Been Solved by an Expert!

Get step-by-step solutions from verified subject matter experts

Step: 2 Unlock
Step: 3 Unlock

Students Have Also Explored These Related General Management Questions!