

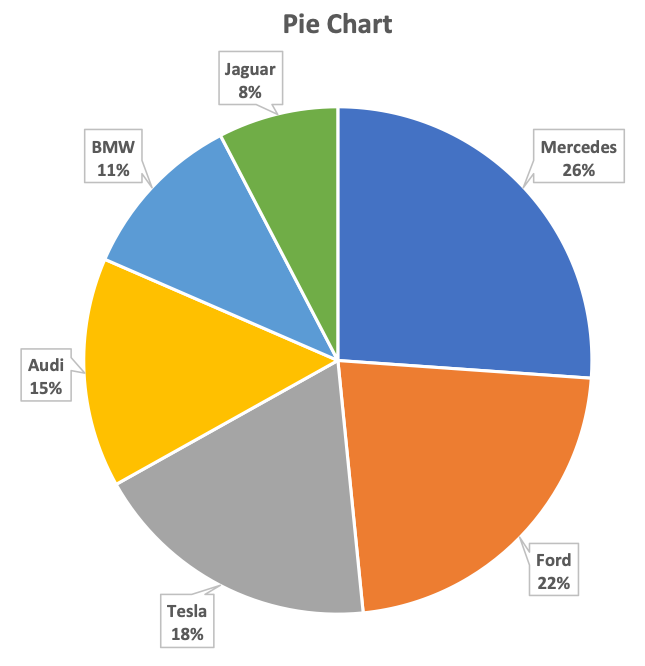
Question: A pie chart is a statistical graph that presents the data as a circle and then shows slices of the total to represents parts of
A pie chart is a statistical graph that presents the data as a circle and then shows slices of the total to represents parts of the data. Pie charts like this one are everywhere.
Step by Step Solution
There are 3 Steps involved in it
1 Expert Approved Answer
Step: 1 Unlock

Question Has Been Solved by an Expert!
Get step-by-step solutions from verified subject matter experts
Step: 2 Unlock
Step: 3 Unlock